Charlotte, NC – Feb. 27, 2018 (PRNewswire) LendingTree®, the nation’s leading online loan marketplace, today released the findings of its study on the best and worst cities for new small businesses. While the success of a new small business is impacted by a combination of factors, some U.S. cities tend to produce more successful start-ups than others.

In a new study, LendingTree used data from more than 80,000 queries submitted by new small business owners seeking loan offers through its small business loan marketplace to determine where businesses tend to do the best.

Annual revenue was the first factor LendingTree researchers considered when ranking cities, as all businesses strive to bring in as much revenue as possible. It’s important to note here that gross revenue doesn’t always correlate directly to profitability, as expenses can vary based on an array of influences, including business type and geography. Therefore, LendingTree analyzed the percentage of businesses that reported they were profitable at the time of their queries. By combining these two data series, they were able to draw a picture of how small businesses are performing, relative to their peers in other places.
The self-reported data was then limited to the 50 most populous metropolitan statistical areas, as defined by the U.S. Census Bureau. Then, the two factors were scaled to 100, added and divided by two, for the highest possible score of 100 and a lowest possible score of zero. The highest actual score was 90; the lowest score was eight.
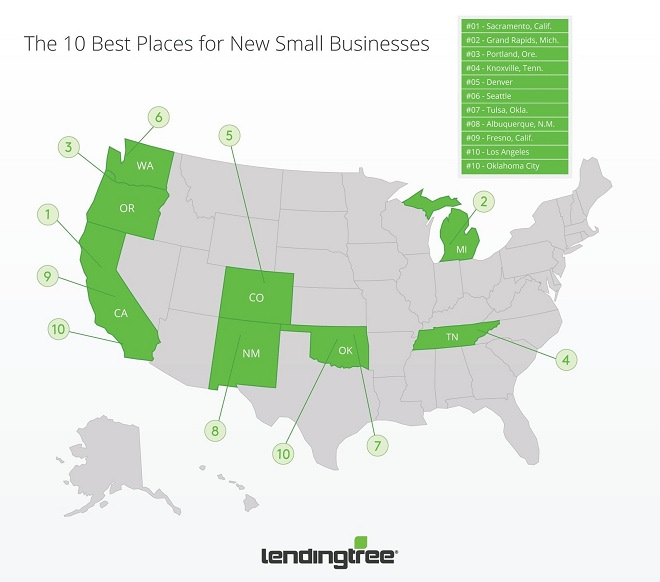
The best cities for new small businesses
First place goes to Sacramento, Calif., where the average annual revenue of businesses was $315,661, and 84.3 percent of rising small businesses were profitable. In fact, three California cities — Sacramento, Los Angeles and Fresno — ranked among the top 10 best places for new small businesses.
Coming in second place overall was Grand Rapids, Mich. Businesses reported an average annual revenue of $293,495 and 85.2 percent of applicants were profitable. Businesses in Grand Rapids reported they were profitable more often than businesses in top-ranked Sacramento.
The opposite happened with Portland, Ore. Rounding out the top three, the city reported an average $317,765 in business revenues and 83.2 percent of businesses reported they were profitable. While Portland’s revenue was higher than top-ranked Sacramento, fewer businesses reported they were profitable, dropping its final score to 83.
The worst cities for new small businesses
Young companies in Cincinnati reported an average annual revenue of $198,516, and about 79.8 percent of businesses reported they were profitable.
The city netted itself a low score of eight, the lowest of any other city. Rochester, N.Y., and Philadelphia follow with final scores of 14 and 17, respectively.
Hunter Stunzi, SVP of Small Business at LendingTree, said every small business should consider the questions below before opening day:
1. What problem are you solving? Every business needs to solve a specific problem or a part of a problem. If you’re not solving a problem for a customer or partner, odds are you are not creating value and don’t have a business.
2. How much capital do you need to fund the first year of the business? Whatever you think you need double it. Most businesses fail because they don’t have a capital cushion to absorb mistakes – and there will be plenty.
3. How is the business being funded? Friends and family, personal funds, a loan? The source of funds can have nasty consequences if not thought through.
4. How will you acquire customers? Will you grow your business organically (i.e. word of mouth) or online search? Have a plan and don’t overpay.
5. Will you have partners? Everyone’s responsibilities must be clearly agreed upon in writing before you get started. Is your partner active in the business or silent? What happens when a partner doesn’t do his/her job?
6. Will you pay yourself a salary? If so how much? Be prepared to pay yourself last and take a pay cut-period.
7. Do you have an operating agreement? Set up a proper operating agreement with all partners when you from/fund the business. This will clearly define the owners, ownership stakes and responsibilities.
8. Who will keep the books? You need to know your numbers. It’s important to start off on the right foot and track every expense and receivable. Otherwise you’re sailing with no compass.
9. Where do you see your business in 3, 5 and 10 years? How much revenue will you be generating, how many employees will you have, how profitable will you be?
10. How much pain can you take? At what point do you shut the business down? It’s a tough conversation but worth exploring your limits and when to fold. Unfortunately, the reality is that is many businesses fail.
Businesses included in the analysis met the following requirements:
1. Earn an annual revenue of less than $7,500,000
2. Have been in business for at least six months and no longer than 60 months
3. Submitted a loan query to LendingTree between Jan. 1, 2016 and Jan. 23, 2018
Applicants self-reported their business’s annual revenue, if the business was profitable at the time they applied for the loan and the zip code of the business.
The study was limited to businesses that submitted query forms between six and 60 months after the business was founded, as researchers considered six months a reasonable amount of time to predict annual revenue, and businesses older than five years could be considered established rather than new.
For the full report, visit: www.lendingtree.com.

About LendingTree:
LendingTree (NASDAQ: TREE) is the nation’s leading online loan marketplace, empowering consumers as they comparison-shop across a full suite of loan and credit-based offerings. LendingTree provides an online marketplace which connects consumers with multiple lenders that compete for their business, as well as an array of online tools and information to help consumers find the best loan. Since inception, LendingTree has facilitated more than 65 million loan requests. LendingTree provides free monthly credit scores through My LendingTree and access to its network of over 500 lenders offering home loans, personal loans, credit cards, student loans, business loans, home equity loans/lines of credit, auto loans and more. LendingTree, LLC is a subsidiary of LendingTree, Inc. For more information go to www.lendingtree.com, dial 800-555-TREE, like our Facebook page and/or follow us on Twitter @LendingTree.
Media Contact:
Megan Greuling
(704) 943-8208
Megan.greuling@lendingtree.com
Like this:
Like Loading...