LendingTree Reveals How Your Neighbors Are Utilizing Equity in Their Homes

New LendingTree study shows the top uses of home equity loans by city

Charlotte, NC – June 18, 2018 (PRNewswire) LendingTree®, the nation’s leading online loan marketplace, today released its study on the top uses of home equity loans by city.

lendingtree

LendingTree assessed home equity loan requests since the start of 2018 to reveal the primary reasons borrowers are utilizing the funds and compared the data across cities to find regional biases in how home equity loans are used. The study also provides other metrics including loan size, LTV and the age of the borrowers. LendingTree data tracks six uses for home equity loans — home improvement, debt consolidation, retirement income, investment property, emergency funds and other uses.

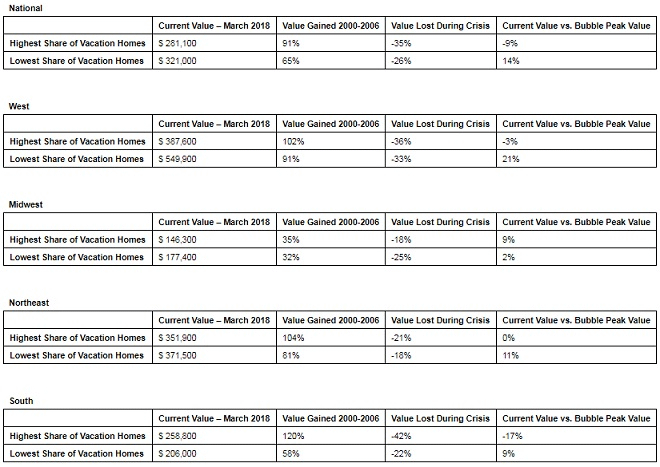
“Home prices have been steadily increasing and have now surpassed the pre-financial crisis highs,” said Tendayi Kapfidze, LendingTree’s Chief Housing Economist. “While this may pose a challenge for those looking to purchase homes, those who own homes can stand to benefit by leveraging the growing equity in their homes, using those funds for other expenses.”

“Responsible home equity borrowing can be a valuable source of funds for life events,” Kapfidze added. “It’s important to note that this new wave of home equity lending is far different from the equity extraction that occurred prior to the financial crisis, and lending standards are much more stringent today. Most home equity borrowers today have far higher credit scores and borrow less of the accumulated appreciation in their home.”

Chart

Chart

Key findings from the study include:

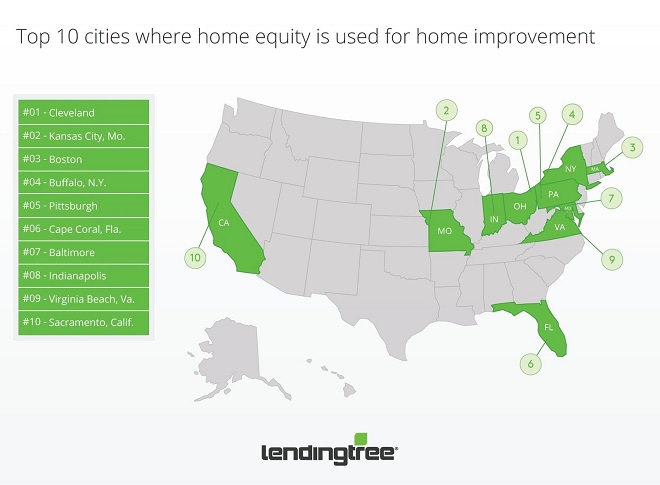
  • Home improvement tops the list of uses for home equity loans. The most common use was home improvement, at 43 percent of home equity loan requests.
  • Real estate investors borrow the most. Borrowers who were looking to invest in another property had the highest property values and requested loan amounts. For property investments, borrowers requested an average of $103,625.
  • For non-property investments, which likely include small businesses, borrowers requested $80,241.
  • Just over 1 percent of requests were to fund retirement. Not surprisingly, this cohort had the highest average age of 63 — 12 years above the next highest average age.
  • A small share accessed their home equity for emergency expenses. This group had the lowest loan amount requested of $35,747 and kept their LTV low at 51 percent.
  • Debt consolidators push the limits on LTV. Borrowers looking to consolidate debt had the highest LTV of 74 percent.

Chart

Top cities for home improvement

#1 Cleveland

  • Share of home equity loan requests: 50%
  • Median loan amount: $30,000

#2 Kansas City, Mo.

  • Share of home equity loan requests: 49%v
  • Median loan amount: $30,000

#3 Boston

  • Share of home equity loan requests: 49%
  • Median loan amount: $50,000

Top cities for debt consolidation

#1 Raleigh, N.C.

  • Share of home equity loan requests: 48%
  • Median loan amount: $30,000

#2 Minneapolis

  • Share of home equity loan requests: 47%
  • Median loan amount: $30,000

#3 Las Vegas, N.V.

  • Share of home equity loan requests: 47%
  • Median loan amount: $35,000

Top cities for other investment purposes

#1 San Jose, Calif.

  • Share of home equity loan requests: 15%
  • Median loan amount: $160,000

#2 Miami

  • Share of home equity loan requests: 12%
  • Median loan amount: $82,500

#3 Austin, Texas

  • Share of home equity loan requests: 11%
  • Median loan amount: $85,000

Top cities for retirement

#1 Cape Coral, Fla

  • Share of home equity loan requests: 5.1%
  • Median loan amount: $50,000

#2 Daytona Beach, Fla

  • Share of home equity loan requests: 3.3%
  • Median loan amount: $50,000

#3 Charleston, S.C.

  • Share of home equity loan requests: 2.5%
  • Median loan amount: $50,000

Top cities for investment property

#1 San Jose, Calif.

  • Share of home equity loan requests: 1.2%
  • Median loan amount: $300,000

#2 Raleigh, N.C.

  • Share of home equity loan requests: 0.8%
  • Median loan amount: $75,000

#3 Miami

  • Share of home equity loan requests: 0.7%
  • Median loan amount: $65,000

To view the full ranking and report, visit: www.lendingtree.com.

About LendingTree
LendingTree (NASDAQ: TREE) is the nation’s leading online loan marketplace, empowering consumers as they comparison-shop across a full suite of loan and credit-based offerings. LendingTree provides an online marketplace which connects consumers with multiple lenders that compete for their business, as well as an array of online tools and information to help consumers find the best loan. Since inception, LendingTree has facilitated more than 65 million loan requests. LendingTree provides free monthly credit scores through My LendingTree and access to its network of over 500 lenders offering home loans, personal loans, credit cards, student loans, business loans, home equity loans/lines of credit, auto loans and more. LendingTree, LLC is a subsidiary of LendingTree, Inc. For more information go to www.lendingtree.com, dial 800-555-TREE, like our Facebook page and/or follow us on Twitter @LendingTree.

MEDIA CONTACT:

Megan Greuling
(704) 943-8208
Megan.greuling@lendingtree.com

Vacation Home Markets Haven’t Yet Regained All Their Lost Value

– Markets with the highest concentrations of vacation homes saw a more exaggerated bubble and bust cycle than the rest of the housing market

– Markets with the highest densities of vacation homes remain 9 percent below their pre-crisis peak value, while those where vacation homes are least common are 14 percent above their peak.

– During the housing boom, home values in vacation markets climbed 117 percent, compared to an 83 percent increase in markets with the smallest share of vacation homes.

– Vacation markets have seen slower home-value appreciation than the overall market in all but one year since 2010.

Seattle, WA – June 13, 2018 (PRNewswire) In places where vacation homes are most common, the housing crisis still shows a noticeable effect on the market.

Zillow Logo

Scattered across the country, vacation home markets(i) experienced a steeper run up in home values during the housing bubble, but also a sharper fall. Vacation home markets gained 117 percent in value between 2000 and 2006, compared with an 83 percent home value increase in places with the smallest share of vacation homes. However, the losses were greater when the housing market crashed, with home values falling 35 percent and 26 percent, respectively.

Along the eastern shore of Hilton Head Island(ii), where 54 percent of homes are vacation homes, the typical home gained 95 percent in value between 2000 and 2006, then lost 41 percent. In comparison, Beaufort County overall gained 67 percent in value, but only fell 36 percent.

In Cape Cod, where 39 percent of homes are vacation homes(iii), the typical home gained 83 percent in value between 2000 and 2006, then lost 19 percent. The state of Massachusetts as a whole only gained 56 percent in value, but also fell 19 percent.

The recovery has also been slower to reach vacation home markets. Since 2010, home value appreciation in these markets has been slower than the rest of the market every year except 2012. Home values grew 0.7 percentage points less in vacation markets in 2017 than they did in the rest of the country.

As a result of this slower home value growth during the recovery, home values in vacation home markets are still 9 percent below the peak reached at the height of the housing bubble. By contrast, markets with the smallest share of vacation homes(iv) are 14 percent more valuable than they were before the recession.

“Vacation home markets have lagged the rest of the country during the economic recovery, despite an exaggerated boom and bust a decade ago,” said Zillow® senior economist Aaron Terrazas. “As the economy improves and more Americans feel secure in their personal finances and primary residences, it is possible that more will look to buy a vacation home. The good news is that there are still bargains to be found in many vacation communities, but recent tax changes will eat into the tax benefits of second-home ownership. Beyond financial considerations, Americans are increasingly conscious of the environmental risks common in many vacation communities, including those from rising sea levels and storm surges, hurricanes and wildfires.”

The Southern and Western regions have the biggest gap between the recovery in vacation markets and the overall housing market. Home values in Southern vacation home markets are still 17 percent below the highest point they reached during the housing bubble, while markets with the smallest share of vacation homes are 9 percent more valuable. In the West, places with the lowest concentration of vacation homes are 21 percent higher than they were during the housing bubble, and vacation home markets are still 3 percent lower than their bubble peak value.

The Midwest is the only region where vacation home markets have recovered better than areas where vacation homes are less common – home values in vacation markets are 9 percent higher than the bubble. In places where vacation homes are least common, home values are 2 percent above their peak levels from the housing bubble.

Chart

Zillow
Zillow is the leading real estate and rental marketplace dedicated to empowering consumers with data, inspiration and knowledge around the place they call home, and connecting them with great real estate professionals. In addition, Zillow operates an industry-leading economics and analytics bureau led by Zillow Group’s Chief Economist Dr. Svenja Gudell. Dr. Gudell and her team of economists and data analysts produce extensive housing data and research covering more than 450 markets at Zillow Real Estate Research. Zillow also sponsors the quarterly Zillow Home Price Expectations Survey, which asks more than 100 leading economists, real estate experts and investment and market strategists to predict the path of the Zillow Home Value Index over the next five years. Launched in 2006, Zillow is owned and operated by Zillow Group, Inc. (NASDAQ: Z and ZG), and headquartered in Seattle.

Zillow is a registered trademark of Zillow, Inc.

(i) Classified as any ZIP code with more than 10 percent of homes whose primary use was “recreational, seasonal or occasional” according to the 2000 Census.

(ii) ZIP code 29928

(iii) https://www.zillow.com/research/places-most-vacation-homes-19835/

(iv) Classified as any ZIP code with less than 5 percent of homes whose primary use was “recreational, seasonal or occasional” according to the 2000 Census.

CoreLogic Reports Home Equity Gains Topped $1 Trillion in the First Quarter of 2018

– In the First Quarter of 2018, 84,000 Residential Properties Regained Equity
– About 2.5 Million Mortgaged Residential Properties Are Still in Negative Equity
– An Additional 500,000 Properties Would Return to an Equity Position if Home Prices Gained Another 5 Percent
– Over the Past Four Quarters, the Average Homeowner Gained $16,300 in Home Equity

Irvine, CA – June 7th (BUSINESS WIRE) CoreLogic® (NYSE: CLGX), a leading global property information, analytics and data-enabled solutions provider, today released the Home Equity Report for the first quarter of 2018, which shows that U.S. homeowners with mortgages (which account for roughly 63 percent of all properties) have seen their equity increase 13.3 percent year over year, representing a gain of $1.01 trillion since the first quarter of 2017.

CoreLogic Logo

Additionally, the average homeowner gained $16,300 in home equity between the first quarter of 2017 and the first quarter of 2018. While home equity grew nationwide, western states experienced the largest increase. Washington homeowners gained an average of approximately $44,000 in home equity, and California homeowners gained an average of approximately $51,000 in home equity (Figure 1).

From the fourth quarter of 2017 to the first quarter of 2018, the total number of mortgaged homes in negative equity decreased 3 percent to just under 2.5 million homes or 4.7 percent of all mortgaged properties. Negative equity decreased 21 percent year over year from 3.1 million homes – or 6.1 percent of all mortgaged properties – in the first quarter of 2017.

“Home-price growth has accelerated in recent months, helping to build home-equity wealth and lift underwater homeowners back into positive equity the primary driver of home equity wealth creation,” said Dr. Frank Nothaft, chief economist for CoreLogic. “The CoreLogic Home Price Index grew 6.7 percent during the year ending March 2018, the largest 12-month increase in four years. Likewise, the average growth in home equity was more than $15,000 during 2017, the most in four years. Washington led all states with 12.8 percent appreciation, and its homeowners also had much larger home-equity gains than the national average.”

Chart 1

Chart 2

Chart 3

Chart 4

Negative equity, often referred to as being underwater or upside down, applies to borrowers who owe more on their mortgages than their homes are worth. Negative equity can occur because of a decline in a home’s value, an increase in mortgage debt or both. Negative equity peaked at 26 percent of mortgaged residential properties in the fourth quarter of 2009, based on the CoreLogic equity data analysis which began in the third quarter of 2009.

The national aggregate value of negative equity was approximately $284.8 billion at the end of the first quarter of 2018. This is up quarter over quarter by approximately $100 million, from $284.7 billion in the fourth quarter of 2017.

“Home equity balances continue to grow across the nation,” said Frank Martell, president and CEO of CoreLogic. “In the far Western states, equity gains are fueled by a long run in home price escalation. With strong economic growth and higher purchase demand, we expect these trends to continue for the foreseeable future.”

For ongoing housing trends and data, visit the CoreLogic Insights Blog: www.corelogic.com.

Methodology

The amount of equity for each property is determined by comparing the estimated current value of the property against the mortgage debt outstanding (MDO). If the MDO is greater than the estimated value, then the property is determined to be in a negative equity position. If the estimated value is greater than the MDO, then the property is determined to be in a positive equity position. The data is first generated at the property level and aggregated to higher levels of geography. CoreLogic data includes more than 50 million properties with a mortgage, which accounts for more than 95 percent of all mortgages in the U.S. CoreLogic uses public record data as the source of the MDO, which includes both first-mortgage liens and second liens, and is adjusted for amortization and home equity utilization in order to capture the true level of MDO for each property. The calculations are not based on sampling, but rather on the full data set to avoid potential adverse selection due to sampling. The current value of the property is estimated using a suite of proprietary CoreLogic valuation techniques, including valuation models and the CoreLogic Home Price Index (HPI). In August 2016, the CoreLogic HPI was enhanced to include nearly one million additional repeat sales records from proprietary data sources that provide greater coverage in home price changes nationwide. The increased coverage is particularly useful in 14 non-disclosure states. Additionally, a new modeling methodology has been added to the HPI to weight outlier pairs, ensuring increased consistency and reducing month-over-month revisions. The use of the enhanced CoreLogic HPI was implemented with the Q2 2016 Equity report. Only data for mortgaged residential properties that have a current estimated value are included. There are several states or jurisdictions where the public record, current value or mortgage data coverage is thin and have been excluded from the analysis. These instances account for fewer than 5 percent of the total U.S. population. The percentage of homeowners with a mortgage is from the 2016 American Community Survey. Fourth quarter of 2017 data was revised. Revisions with public records data are standard, and to ensure accuracy, CoreLogic incorporates the newly released public data to provide updated results.

Source: CoreLogic

The data provided is for use only by the primary recipient or the primary recipient’s publication or broadcast. This data may not be re-sold, republished or licensed to any other source, including publications and sources owned by the primary recipient’s parent company without prior written permission from CoreLogic. Any CoreLogic data used for publication or broadcast, in whole or in part, must be sourced as coming from CoreLogic, a data and analytics company. For use with broadcast or web content, the citation must directly accompany first reference of the data. If the data is illustrated with maps, charts, graphs or other visual elements, the CoreLogic logo must be included on screen or website. For questions, analysis or interpretation of the data, contact Alyson Austin at newsmedia@corelogic.com or Allyse Sanchez at corelogic@ink-co.com. Data provided may not be modified without the prior written permission of CoreLogic. Do not use the data in any unlawful manner. This data is compiled from public records, contributory databases and proprietary analytics, and its accuracy depends upon these sources.

About CoreLogic

CoreLogic (NYSE: CLGX) is a leading global property information, analytics and data-enabled solutions provider. The company’s combined data from public, contributory and proprietary sources includes over 4.5 billion records spanning more than 50 years, providing detailed coverage of property, mortgages and other encumbrances, consumer credit, tenancy, location, hazard risk and related performance information. The markets CoreLogic serves include real estate and mortgage finance, insurance, capital markets, and the public sector. CoreLogic delivers value to clients through unique data, analytics, workflow technology, advisory and managed services. Clients rely on CoreLogic to help identify and manage growth opportunities, improve performance and mitigate risk. Headquartered in Irvine, Calif., CoreLogic operates in North America, Western Europe and Asia Pacific. For more information, please visit www.corelogic.com.

CORELOGIC and the CoreLogic logo are trademarks of CoreLogic, Inc. and/or its subsidiaries. All other trademarks are the property of their respective owners.

Contacts

Media Contacts:
CoreLogic

Alyson Austin
Corporate Communications
(949) 214-1414
newsmedia@corelogic.com

or

INK Communications
Allyse Sanchez
(925) 548-2535
corelogic@ink-co.com