U.S. Median Home Price Appreciation Decelerates In Q2 2018 To Slowest Pace In Two Years

Median Home Prices Above Pre-Recession Levels in 65 Percent of Local Markets; Average Homeownership Tenure Increases to New Record High; Distressed Sales Share Drops to 11-Year Low

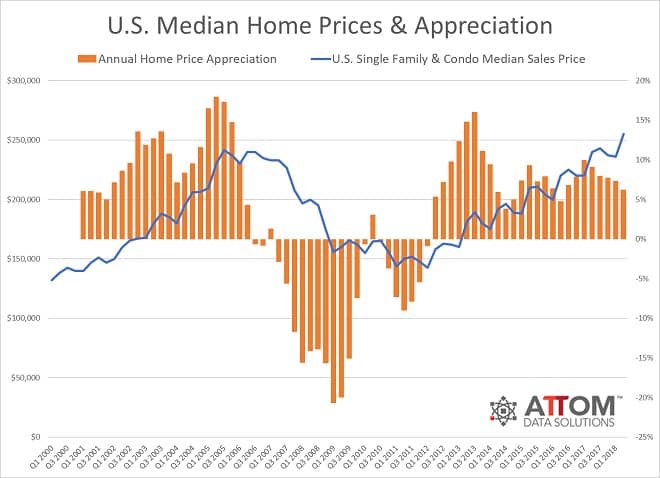
Irvine, CA – July 26, 2018 (PRNewswire) ATTOM Data Solutions, curator of the nation’s premier property database, today released its Q2 2018 U.S. Home Sales Report, which shows that U.S. single family homes and condos sold for a median price of $255,000 in the second quarter, up 6.3 percent from a year ago to a new all-time high but the slowest annual appreciation since Q2 2016.

ATTOM Logo

“Annual home price appreciation nationwide has now slowed for five consecutive quarters following a post-election spike to double-digit appreciation in the first quarter of 2017,” said Daren Blomquist, senior vice president at ATTOM Data Solutions. “Although home sellers are still in the driver’s seat of this housing market, moderating home price appreciation is good news for prospective homebuyers and signals that rising mortgage rates and other housing headwinds are cooling red-hot home price appreciation in some areas.”

Chart

Annual home price appreciation slows in 66 percent of local markets

Annual home price appreciation in Q2 2018 decelerated from the previous quarter in 80 of the 122 metros (66 percent) analyzed for median home prices, including Los Angeles, Chicago, Dallas-Fort Worth, Houston and Philadelphia.

Counter to the national trend, annual home price appreciation accelerated from the previous quarter in 42 of the 122 metros analyzed (34 percent), including New York, Washington, D.C., Boston, San Francisco and Detroit.

Price-per-square foot appreciation accelerates for homes selling above $1 million

The median price per square foot for homes that sold for $1 million or more in the second quarter increased 5.4 percent from a year ago, accelerating from 3.2 percent annual appreciation in the previous quarter and from 3.4 percent annual appreciation in Q2 2017.

The median price per square foot for homes that sold for under $1 million in the first quarter increased 6.5 percent from a year ago, but that was down from 8.2 percent annual appreciation in the previous quarter and down from 9.0 percent annual appreciation in Q2 2017.

In 49 counties with at least 100 single family and condo sales above $1 million in Q2 2018, median price per square foot appreciation accelerated compared to a year ago in the above-$1 million category in 32 of those counties (65 percent), including Santa Clara County (San Jose), California; Orange County, California; King County (Seattle), Washington; Alameda County (San Francisco), California; and San Diego County, California.

Median price per square foot appreciation decelerated compared to a year ago in the above-$1 million category in 17 of the 49 counties (35 percent) with at least 100 single family home and condo sales above $1 million in Q2 2018, including Los Angeles County, California; Miami-Dade County, Florida; Marin County (San Francisco area), California; Maricopa County (Phoenix), Arizona; and New York County (Manhattan), New York.

Chart

Fastest home price appreciation in San Jose, Flint, Seattle, Boise, San Francisco

Among 122 metropolitan statistical areas analyzed in the report, those with the biggest year-over-year increase in median prices were San Jose, California (up 25.0 percent); Flint, Michigan (up 23.7 percent); Seattle, Washington (up 14.3 percent); Boise, Idaho (up 14.3 percent); and San Francisco, California (up 14.2 percent).

“Home prices in the greater Seattle region continue to grow at well above long-term averages for several reasons,” said Matthew Gardner, chief economist with Windermere Real Estate, covering the Seattle market. “Firstly, the area’s booming economy continues to add jobs, driving up demand for housing. Compounding this demand is a lack of new construction housing, which puts substantial upward pressure on home prices in the resale market. Housing affordability is unquestionably a major issue in Seattle; however, ironically enough, the many California buyers relocating to the Seattle area actually think our home prices are a bargain!”

Q2 2018 Home Price Appreciation Heat Map

Median home prices above pre-recession levels in 65 percent of markets

The U.S. median home price of $255,000 in Q2 2018 was 6 percent above the pre-recession peak of $241,648 in Q3 2005.

Median home prices in 79 of the 122 metro areas analyzed for median home prices in the report (65 percent) were above their pre-recession peaks in Q2 2018, led by Houston, Texas (79 percent above); Dallas-Fort Worth (78 percent above); Greeley, Colorado (76 percent above); Denver, Colorado (75 percent above); and San Antonio, Texas (68 percent above).

Median home prices in Q2 2018 were still below pre-recession peaks in 43 of the 122 metros analyzed for median home prices (35 percent), led by Atlantic City, New Jersey (36 percent below); York, Pennsylvania (34 percent below); Salisbury, Maryland (21 percent below); Naples, Florida (19 percent below); and Trenton, New Jersey (18 percent below).

Average homeownership tenure increases to new all-time high of 8.09 years

Homeowners who sold in Q2 2018 had owned their homes for an average of 8.09 years, up from an average homeownership tenure of 7.91 years in Q1 2018 and up from an average homeownership tenure of 7.83 years in Q2 2017.

Counter to the national trend, average homeownership tenure declined in 22 of 108 (20 percent) metropolitan statistical areas analyzed for homeownership tenure, including Sacramento, California; Nashville, Tennessee; Salt Lake City, Utah; Honolulu, Hawaii; and New Haven, Connecticut.

Chart

Average home seller gains increase to highest level since Q3 2007

Homeowners who sold in Q2 2018 sold for an average of $58,000 more than their original purchase price, the highest average home seller price gain since Q3 2007.

The $58,000 average home seller price gain in Q2 2018 represented an average 30.2 percent return on the original purchase price, up from an average 28.9 percent return in the first quarter but down from a recent peak of 30.8 percent in Q4 2017.

Among 147 metropolitan statistical areas analyzed for average home seller gains, those with the highest average percentage gain were San Jose, California (116.6 percent); San Francisco, California (85.0 percent); Seattle, Washington (76.5 percent); Boston, Massachusetts (64.3 percent); and Portland, Oregon (62.1 percent).

Distressed sales drop to an 11-year low

Distressed sales — sales of bank-owned homes, short sales, and sales to third-party investors at foreclosure auction — accounted for 11.9 percent of all single family home and condo sales in Q2 2018, down from 14.9 percent in the previous quarter and down from 13.5 percent in Q2 2017 to the lowest level since Q2 2007, an 11-year low.

States with the highest share of distressed sales in Q2 2018 were New Jersey (23.9 percent), Delaware (22.5 percent), Rhode Island (18.6 percent), Connecticut (17.6 percent), and Illinois (17.3 percent).

Among 148 metropolitan statistical areas analyzed for distressed sales, those with the highest share in Q2 2018 were Atlantic City, New Jersey (42.1 percent); Trenton, New Jersey (26.0 percent); Youngstown, Ohio (25.4 percent); Syracuse, New York (24.8 percent); and Hagerstown, Maryland (22.1 percent).

Among 52 metro areas with a population of 1 million or more, those with the highest share of distressed sales in Q2 2018 were Baltimore, Maryland (20.7 percent); Philadelphia, Pennsylvania (20.2 percent); New York-Newark-Jersey City (20.0 percent); Cleveland, Ohio (19.0 percent); and Providence, Rhode Island (18.7 percent).

Other report findings

  • Sales to buyers using FHA loans — typically first-time homebuyers — accounted for 10.7 percent of all sales of single family homes and condos in Q2 2018, down from 11.9 percent in the previous quarter and down from 14.0 percent in Q2 2017 to the lowest level since Q1 2008 — a more than 10-year low.
  • All-cash purchases accounted for 27.2 percent of all single family home and condo sales in Q2 2018, down from 28.8 percent in the previous quarter and down from 27.6 percent in Q2 2017 to the lowest level since Q3 2016.
  • Sales to institutional investors (entities buying at least 10 properties in a calendar year) accounted for 2.0 percent of all single family home and condo sales in Q2 2018, up from 1.9 percent in the previous quarter but still down from 2.3 percent in Q2 2017.

Report methodology

The ATTOM Data Solutions U.S. Home Sales Report provides percentages of distressed sales and all sales that are sold to investors, institutional investors and cash buyers, at the state and metropolitan statistical area. Data is also available at the county and zip code level upon request. The data is derived from recorded sales deeds, foreclosure filings and loan data. Statistics for previous quarters are revised when each new report is issued as more deed data becomes available for those previous months. Median sales prices are calculated based on the sales price on the publicly recorded sales deed when available. If no sales price is recorded then the purchase loan amount is used to calculate median price, and if no purchase loan amount is available, the property’s Automated Valuation Model (AVM) at time of sale is used to calculate the median price.

Definitions

All-cash purchases: sales where no loan is recorded at the time of sale and where ATTOM has coverage of loan data.

Institutional investor purchases: residential property sales to non-lending entities that purchased at least 10 properties in a calendar year.

REO sale: a sale of a property that occurs while the property is actively bank owned (REO).

Third-party foreclosure auction sale: a sale of a property that occurs at the public foreclosure auction (trustee’s sale or sheriff’s sale) in which the property is sold to a third-party buyer and does not transfer back to the foreclosing bank.

Short sale: a sale of a property where the sale price is less than (short) the combined amount of loans secured by the property.

About ATTOM Data Solutions

ATTOM Data Solutions provides premium property data to power products that improve transparency, innovation, efficiency and disruption in a data-driven economy. ATTOM multi-sources property tax, deed, mortgage, foreclosure, environmental risk, natural hazard, and neighborhood data for more than 155 million U.S. residential and commercial properties covering 99 percent of the nation’s population. A rigorous data management process involving more than 20 steps validates, standardizes and enhances the data collected by ATTOM, assigning each property record with a persistent, unique ID — the ATTOM ID. The 9TB ATTOM Data Warehouse fuels innovation in many industries including mortgage, real estate, insurance, marketing, government and more through flexible data delivery solutions that include bulk file licenses, APIs, market trends, marketing lists, match & append and more.

Media Contact:

Christine Stricker
(949) 748-8428
christine.stricker@attomdata.com

Data and Report Licensing:
(949) 502-8313
datareports@attomdata.com

June Home Prices Rose 5.7% Year Over Year; Smallest Increase Since December 2016

Inventory Declines Continue to Moderate; Number of Homes for Sale in June Down Just 6% Compared to June 2017

Seattle, WA – July 24, 2018 (PRNewswire) (NASDAQ: RDFN) U.S. home-sale prices increased 5.7 percent year over year in June to a median of $312,700, according to Redfin (www.redfin.com), the next-generation real estate brokerage. This is the lowest price growth since December 2016. At the same time, the number of homes for sale in June was down just 6 percent year over year, which continues the gradual easing of year-over-year inventory declines since January of this year.

Redfin Logo

Homes sales fell 3.3 percent in June compared to June 2017. However, it’s important to note this is partially due to the fact that June 2017 had five Thursdays, a common day for home purchases to close, compared to this June, which had just four. If June 2017 did not have the fifth Thursday, year-over-year homes sales would be up by 1.2 percent.

Homes also sold at their fastest pace on record, a median 34 days in June, unchanged from May and three days faster than last year.

Notably, in what have been the most competitive places for homebuyers, inventory is increasing, providing welcome relief for some buyers. The number of homes for sale in June increased by double digits in Portland (31.6%), San Jose, CA (11.9%) and Seattle (24.2%). These markets also experienced sales declines of 9.6 percent, 16.3 percent and 10.1 percent, respectively.

“The affordability crisis may have reached a breaking point in Portland, San Jose and Seattle,” said Redfin CEO Glenn Kelman. “After 75 straight months of price increases in these markets that far outpaced wage growth, homebuyers are now becoming selective about which homes to buy, and at what price. The homes that did sell in June still sold quickly, but buyers were significantly more likely to reject homes that were less desirable or aggressively priced by the seller: the percentage of listings in these markets that sold within two weeks declined in June from 61 percent to 52 percent, and the fraction of listings that dropped their price increased from 31 percent to 33 percent.”

“We’ve seen similar signs of buyer fatigue in the past, especially at this point in the season,” Kelman continued. “But in this case the lull has lasted a bit longer and affected more markets than in the recent past. It’ll be interesting to see whether buyers adjust to the latest price increase and come back in force this fall, or if instead we see these markets shift more in favor of buyers.”

“Buyers are taking advantage of the inventory windfall,” said Shoshana Godwin, a Redfin agent in Seattle. “A handful of my buyers who had been sitting out the market for over a year have, over the last two months, gotten homes under contract. We targeted homes that were still on the market after their offer review date and were able to include most offer contingencies, including the inspection. That’s been virtually unheard of in Seattle for the past few years.”

Redfin will be paying close attention in the coming months to the data and to its agents’ observations to see if the trends in Portland, San Jose and Seattle continue, progress or show up in other markets.

Other June Highlights:

Speed

  • Competitiveness eased in Seattle in terms of the portion of homes selling above asking, down 7.3 percentage points year over year from 62.1% to 54.8%. However, it was still the fastest market, with a sale pending on half of all homes in just seven days, keeping pace with June of last year. It’s important to note that the homes that sold, sold quickly. But more homes stayed on the market, hence the rise in inventory. Denver, Omaha, NE, Tacoma, WA and Grand Rapids, MI were the next fastest markets with eight median days on market each.

Prices

  • San Jose, CA had the nation’s highest price growth, rising 22.4% since last year to $1,225,000. Las Vegas had the second highest growth at 12.8% year-over-year price growth, followed by Oakland, CA (11.9%), Cincinnati (11.4%), and Seattle (11.4%).
  • No metros saw price declines in June.

Sales

  • Just three out of 73 metros saw double-digit sales growth compared to last year. Camden, NJ led the nation in year-over-year sales growth, up 52.4%, followed by Pittsburgh, PA, up 10.4%. Long Island, NY rounded out the top three with sales up 10% from a year ago.
  • Oxnard, CA saw the largest decline in sales since last year, falling 25.6%. Home sales in San Jose, CA and West Palm Beach, FL declined by 16.3% and 15.1%, respectively.

Inventory

  • Baton Rouge, LA had the highest increase in the number of homes for sale, up 51.1% year over year, followed by Portland, OR (31.6%) and Seattle (24.2%).
  • Rochester, NY had the largest decrease in overall inventory, falling 33.3% since last June. Indianapolis (-30.3%), Buffalo, NY (-30.0%), and Milwaukee (-24.2%) also saw far fewer homes available on the market than a year ago.

Redfin Estimate

  • The median list price-to-Redfin Estimate ratio was 93.2% in San Francisco, the lowest of any market. This indicates the typical home for sale in June was listed at a price below its estimated value. Only 6.3% of homes in San Francisco were listed for more than their Redfin Estimate.
  • Conversely, the median list price-to-Redfin Estimate ratio was 102.3% in Miami, FL and 102.1% in West Palm Beach, FL, which means sellers are listing their homes for more than the estimated value in those metro areas. In Miami, FL, 83.4% of homes were listed above their Redfin Estimate, the highest percentage of any metro.

To read the full report, complete with charts and market-level data, please visit: www.redfin.com.

About Redfin

Redfin (www.redfin.com) is the next-generation real estate brokerage, combining its own full-service agents with modern technology to redefine real estate in the consumer’s favor. Founded by software engineers, Redfin has the country’s #1 brokerage website and offers a host of online tools to consumers, including the Redfin Estimate, the automated home-value estimate with the industry’s lowest published error rate for listed homes. Homebuyers and sellers enjoy a full-service, technology-powered experience from Redfin real estate agents, while saving thousands in commissions. Redfin serves more than 80 major metro areas across the U.S. The company has closed more than $60 billion in home sales.

CoreLogic Reports May Home Prices Increased by 7.1 Percent, Consumers Express Desire to Buy Despite High Prices

  • In Hottest Markets, Renters’ Desire to Buy Outpaces Available Sellers by Four Times
  • Washington, Nevada, Idaho and Utah Post Double-digit 12-month Price Growth
  • Home Prices Projected to Increase by 5.1 Percent by May 2019

Irvine, CA – July 3rd, 2018 (BUSINESS WIRE) CoreLogic® (NYSE: CLGX), a leading global property information, analytics and data-enabled solutions provider, today released the CoreLogic Home Price Index (HPI™) and HPI Forecast™ for May 2018, which shows home prices rose both year over year and month over month. Home prices increased nationally by 7.1 percent year over year from May 2017 to May 2018. On a month-over-month basis, prices increased by 1.1 percent in May 2018 – compared with April 2018 – according to the CoreLogic HPI. (April 2018 data was revised. Revisions with public records data are standard, and to ensure accuracy, CoreLogic incorporates the newly released public data to provide updated results each month.)

CoreLogic Logo

Looking ahead, the CoreLogic HPI Forecast indicates that the national home-price index is projected to continue to increase by 5.1 percent on a year-over-year basis from May 2018 to May 2019. On a month-over-month basis, home prices are expected to rise 0.3 percent in June 2018. The CoreLogic HPI Forecast is a projection of home prices that is calculated using the CoreLogic HPI and other economic variables. Values are derived from state-level forecasts by weighting indices according to the number of owner-occupied households for each state.

“The lean supply of homes for sale is leading to higher sales prices and fewer days on market, and the supply shortage is more acute for entry-level homes,” said Dr. Frank Nothaft, chief economist for CoreLogic. “During the first quarter, we found that about 50 percent of all existing homeowners had a mortgage rate of 3.75 percent or less. May’s mortgage rates averaged a seven-year high of 4.6 percent, with an increasing number of homeowners keeping the low-rate loans they currently have, rather than sell and buy another home that would carry a higher interest rate.”

Chart 1

Chart 2

Chart 3

Chart 4

According to the CoreLogic Market Condition Indicators (MCI), an analysis of housing values in the country’s 100 largest metropolitan areas based on housing stock found that 40 percent of metropolitan areas have an overvalued housing market as of May 2018. The MCI analysis categorizes home prices in individual markets as undervalued, at value or overvalued, by comparing home prices to their long-run, sustainable levels, which are supported by local market fundamentals (such as disposable income). Additionally, as of May 2018, 26 percent of the top 100 metropolitan areas were undervalued and 34 percent were at value. When looking at only the top 50 markets based on housing stock, 52 percent were overvalued, 14 percent were undervalued and 34 percent were at value. The MCI analysis defines an overvalued housing market as one in which home prices are at least 10 percent higher than the long-term, sustainable level. An undervalued housing market is one in which home prices are at least 10 percent below the sustainable level.

In 2018, CoreLogic together with RTi Research of Norwalk, Connecticut, conducted an extensive consumer housing sentiment study, combining consumer and property insights. The study assessed attitudes toward homeownership and the drivers of the homebuying or renting decision process. Across the U.S., 15 percent of homeowners and 28 percent of renters have indicated a desire to buy a home in the next 12 months, while only 11 percent have indicated a desire to sell.

The research reported the long-term desire for homeownership is much stronger among renters in markets that have the highest home-price growth. Lagging supply in these markets is likely to continue as fewer current homeowners are considering putting their homes on the market. Over the next 12 months, 41 percent of renters are considering buying while only 11 percent of homeowners are considering selling over that same period. That is nearly four times as many renters than homeowners, which is the crux of the available housing-supply imbalance.

“The CoreLogic consumer research demonstrates that, despite high home prices, renters want to get out of their rental property and purchase a home,” said Frank Martell, president and CEO of CoreLogic. “Even in the most expensive markets, we found four times as many renters looking to buy than homeowners willing to sell. Until more supply becomes available, we will continue to see soaring prices in cities such as Denver, San Francisco and Seattle.”

Methodology

The CoreLogic HPI™ is built on industry-leading public record, servicing and securities real-estate databases and incorporates more than 40 years of repeat-sales transactions for analyzing home price trends. Generally released on the first Tuesday of each month with an average five-week lag, the CoreLogic HPI is designed to provide an early indication of home price trends by market segment and for the “Single-Family Combined” tier, representing the most comprehensive set of properties, including all sales for single-family attached and single-family detached properties. The indices are fully revised with each release and employ techniques to signal turning points sooner. The CoreLogic HPI provides measures for multiple market segments, referred to as tiers, based on property type, price, time between sales, loan type (conforming vs. non-conforming) and distressed sales. Broad national coverage is available from the national level down to ZIP Code, including non-disclosure states.

CoreLogic HPI Forecasts™ are based on a two-stage, error-correction econometric model that combines the equilibrium home price—as a function of real disposable income per capita—with short-run fluctuations caused by market momentum, mean-reversion, and exogenous economic shocks like changes in the unemployment rate. With a 30-year forecast horizon, CoreLogic HPI Forecasts project CoreLogic HPI levels for two tiers — “Single-Family Combined” (both attached and detached) and “Single-Family Combined Excluding Distressed Sales.” As a companion to the CoreLogic HPI Forecasts, Stress-Testing Scenarios align with Comprehensive Capital Analysis and Review (CCAR) national scenarios to project five years of home prices under baseline, adverse and severely adverse scenarios at state, Core Based Statistical Area (CBSA) and ZIP Code levels. The forecast accuracy represents a 95-percent statistical confidence interval with a +/- 2 percent margin of error for the index.

About The 2018 CoreLogic Consumer Housing Sentiment Study

Nationwide survey of 3001 renters and homeowners conducted in first quarter of 2018 by CoreLogic together with RTi Research. The survey has a sampling error of +/- 1.8 percent at the total respondent level with a 95 percent confidence level.

About RTi Research

RTi Research is an innovative, global market research and brand strategy consultancy headquartered in Norwalk, CT. Founded in 1979, RTi has been consistently recognized by the American Marketing Association as one of the top 50 U.S. insights companies. The company serves a broad base of leading firms in Financial Services, Consumer Goods, and Pharmaceuticals as well as partnering with leading academic centers of excellence.

Source: CoreLogic

The data provided are for use only by the primary recipient or the primary recipient’s publication or broadcast. This data may not be resold, republished or licensed to any other source, including publications and sources owned by the primary recipient’s parent company without prior written permission from CoreLogic. Any CoreLogic data used for publication or broadcast, in whole or in part, must be sourced as coming from CoreLogic, a data and analytics company. For use with broadcast or web content, the citation must directly accompany first reference of the data. If the data are illustrated with maps, charts, graphs or other visual elements, the CoreLogic logo must be included on screen or website. For questions, analysis or interpretation of the data, contact Alyson Austin at newsmedia@corelogic.com or Allyse Sanchez at corelogic@ink-co.com. Data provided may not be modified without the prior written permission of CoreLogic. Do not use the data in any unlawful manner. The data are compiled from public records, contributory databases and proprietary analytics, and its accuracy is dependent upon these sources.

About CoreLogic

CoreLogic (NYSE: CLGX) is a leading global property information, analytics and data-enabled solutions provider. The company’s combined data from public, contributory and proprietary sources includes over 4.5 billion records spanning more than 50 years, providing detailed coverage of property, mortgages and other encumbrances, consumer credit, tenancy, location, hazard risk and related performance information. The markets CoreLogic serves include real estate and mortgage finance, insurance, capital markets, and the public sector. CoreLogic delivers value to clients through unique data, analytics, workflow technology, advisory and managed services. Clients rely on CoreLogic to help identify and manage growth opportunities, improve performance and mitigate risk. Headquartered in Irvine, Calif., CoreLogic operates in North America, Western Europe and Asia Pacific. For more information, please visit www.corelogic.com.

CORELOGIC, the CoreLogic logo, CoreLogic HPI and CoreLogic HPI Forecast are trademarks of CoreLogic, Inc. and/or its subsidiaries. All other trademarks are the property of their respective owners.

Contacts

Media Contacts:
Alyson Austin
CoreLogic
Corporate Communications
(949) 214-1414
newsmedia@corelogic.com

or

Allyse Sanchez
INK Communications
(925) 548-2535
corelogic@ink-co.com