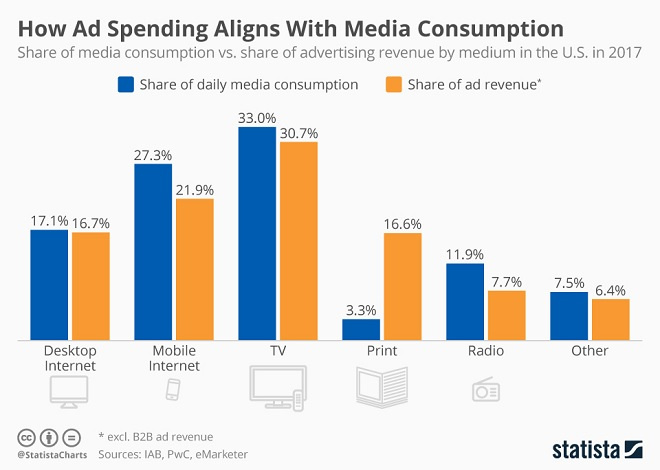
An old advertising adage says that “money follows eyeballs”, meaning that advertising spending will follow wherever consumers focus their attention or spend their time. If this were true, advertising revenue broken down by medium should roughly align with the average time people spend using different media. But is that really the case?
Comparing U.S. ad revenue figures published by the Interactive Advertising Bureau (IAB) to daily media consumption estimates by eMarketer, the following chart shows that both indicators do indeed correlate. In 2017, U.S. consumers spent the most time watching TV and using mobile devices, which is also where the lion’s share of advertising dollars went. There is one notable exception to the rule though: print media, which receives more ad dollars than it should based on how much (or little for that matter) time people spend reading newspapers and magazines.
Does this mean that print publishers should fear a further decrease in ad revenues? Not necessarily. While people may not spend as much time reading as they used to, print advertising is still one of the most trusted and thus effective forms of advertising, which is why brands continue to assign a seemingly disproportionately large share of their ad budgets to print media.