Home Price Growth Hit Six-Year Low in December as Sales Fell 11 Percent, Redfin Reports

Boston and San Jose Both Saw Home-Sale Prices Fall Year Over Year in December

Seattle, WA – Jan. 17, 2019 (PRNewswire) (NASDAQ: RDFN) — U.S. home-sale prices increased just 1.2 percent in December compared to a year ago to a median of $289,800, according to a housing market analysis from Redfin (www.redfin.com), the next-generation real estate brokerage. The year-over-year increase in home prices was the smallest since the number went positive in March 2012.

The median sale price of homes sold in December fell since last year in nine of the 76 largest metro areas Redfin tracks, including San Jose (-7.3%) and Boston (-1.0%). December was the first month either metro saw home prices fall year over year since January 2012. The swing in home prices has been especially dramatic in San Jose, which saw year-over-year gains in excess of 20 percent between November 2017 and June 2018.

Meanwhile, the national number of completed home sales fell faster than it has in two and a half years, down 10.9 percent from December 2017. Home sales declined in 69 of the 76 largest metro areas that Redfin tracks.

“December may feel like a foot on the brake, but the housing market was going over the speed limit,” said Redfin chief economist Daryl Fairweather. “Home prices have been growing faster than wages since 2012, and that can’t go on forever. Now that price growth has slowed down and more homes are sitting on the market, buyers will have the upper hand in 2019. Buyers will have more options with more homes for sale, and it will be sellers working to woo buyers into making an offer. And as a bonus, buyers, for the time being, have the benefit of mortgage interest rates that are lower than they were in late 2018, which will make borrowing more affordable.”

The number of homes newly listed for sale in December fell from a year earlier (-4.1%), but due to the large decrease in home sales, the growth in the number of homes for sale on the market hit a 42-month high, rising 4.8 percent in December.

“Buyers shopping now are benefiting from sellers who are willing to negotiate, since it’s anyone’s guess what the spring real estate market will look like,” said Seattle-based Redfin agent Jessie Culbert. “Well-priced, appealing homes are seeing the return of pre-inspections and even multiple offer situations, so it may be too soon to get comfortable with the idea of a slower market.”

Of the 76 largest metro areas in the country, 46 saw an increase in the number of homes for sale compared to a year earlier, with the largest gains coming in San Jose (+131.3%), Seattle (+117.8%) and Oakland (+69.0%). The metro areas with the biggest decline in homes for sale were New Orleans (-32.3%), Montgomery County, PA (-24.3%) and Philadelphia (-22.4%).

Chart

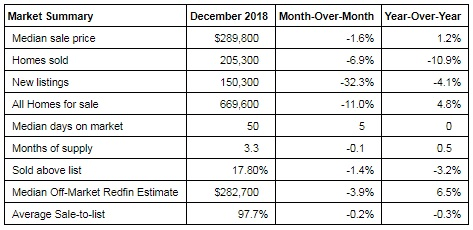
Across Redfin metros, the typical home that sold in December went under contract in a median of 50 days, the same speed as a year earlier. This past December, 18 percent of homes sold above the list price, down from 21 percent from the prior December. Meanwhile the share of homes with a price drop dipped to 16 percent, slightly higher than December 2017’s share of 14 percent. The share of homes that went under contract within two weeks was up month-over-month, increasing from 25 percent in November to 31 percent in December, but was down from 34 percent in December 2017.

Other December Highlights

Competition

  • Grand Rapids, MI was the fastest market, with half of all homes pending sale in just 21 days, down from 26 days a year earlier. Boston and Omaha, NE were the next fastest markets with 23 median days on market, followed by Philadelphia (25) and Rochester, NY (28).
  • The most competitive market in December was San Francisco where 52.2% of homes sold above list price, followed by 41.5% in Oakland, CA, 39.6% in San Jose, CA, 32.8% in Tacoma, WA, and 31.9% in Buffalo, NY.

Prices

  • Pittsburgh had the nation’s highest price growth, rising 11.7% since last year to $162,000. Salt Lake City had the second highest growth at 10.0% year-over-year price growth, followed by Greenville, SC (9.5%), New Haven, CT (8.8%), and Las Vegas (8.6%).
  • 9 metros saw price declines in December. Honolulu home prices declined the most since last year falling 9 percent to $537,000.

Sales

Sacramento, CA saw the largest decline in sales since last year, falling 26.4%. Home sales in Orange County, CA and Seattle declined by 22.5% and 22.0%, respectively.
Nassau & Suffolk Counties, NY led the nation in year-over-year sales growth, up 22.1%, followed by Camden, NJ, up 17.0%. Detroit rounded out the top three with sales up 6.9% from a year ago.

Inventory

  • San Jose, CA had the highest increase in the number of homes for sale, up 131.3% year over year, followed by Seattle (117.8%) and Oakland, CA (69.0%).
  • New Orleans had the largest decrease in overall inventory, falling 32.3% since December 2017. Montgomery County, PA (-24.3%), Philadelphia (-22.4%), and Rochester, NY (-22.3%) also saw far fewer homes available on the market than a year ago.

To read the full report, complete with graphs, charts and market-level data, please visit: www.redfin.com.

About Redfin
Redfin (www.redfin.com) is the next-generation real estate brokerage, combining its own full-service agents with modern technology to redefine real estate in the consumer’s favor. Founded by software engineers, Redfin has the country’s #1 brokerage website and offers a host of online tools to consumers, including the Redfin Estimate, the automated home-value estimate with the industry’s lowest published error rate for listed homes. Homebuyers and sellers enjoy a full-service, technology-powered experience from Redfin real estate agents, while saving thousands in commissions. Redfin serves more than 85 major metro areas across the U.S. The company has closed more than $60 billion in home sales.

RE/MAX National Housing Report for December 2018

2018 Home Sales Cool Off, While Inventory Recovers and Price Increases Moderate

Denver, CO – Jan. 17, 2019 (PRNewswire) December’s declining home sales and growing inventory solidified 2018 as the year the red-hot seller’s market moved toward a balanced market. Price growth also moderated, though December was the 33rd consecutive month of year-over-year increases in home prices, according to the RE/MAX National Housing Report, which includes 53 metro areas.

Remax Logo

December’s year-over-year decline in home sales of 12.1% set a December record in the 10-year history of the report and also marked the fifth consecutive month that home sales were lower than 2017. December was 2018’s 10th month of year-over-year declines in home sales with only April and July topping 2017 sales.

Most telling was December’s 4.6% growth in inventory, which was also a report record. December’s year-over-year inventory increase marked the third consecutive month of growth – a trend reversing a decade-long streak of year-over-year inventory declines.

“December’s inventory gain, continuing the three-month growth trend, is welcome news,” said RE/MAX CEO Adam Contos. “The market remains choppy and there’s still a long way to go, but these gains represent steps toward a balanced market, which in the long run is healthy for both buyers and sellers.”

While 54 Days on Market was a record low for December sold listings, the 4.1 Months Supply of Inventory was higher than December 2017’s 3.7 months and ahead of November 2018’s 3.9 months supply.

Home buyers paid record amounts throughout 2018 as prices grew year-over-year in every month last year, led by June’s Median Sold Price of $258,500 – an all-time report high. Even so, December’s year-over-year increase of 2.1% was 2018’s smallest, and far lower than the 8.1% price growth from December 2016 to December 2017.

“Home sales have cooled, especially during the second half of 2018, but that was inevitable given the strong seller’s market that has persisted for nearly a decade,” Contos said. “We believe sales activity can pick back up if the pace of price escalation continues to moderate, interest rates tick further downward, and wage growth continues.”

Closed Transactions
Of the 53 metro areas surveyed in December 2018, the overall average number of home sales is down -8.5% compared to November 2018, and down -12.1% compared to December 2017. None of the 53 metro areas experienced an increase in sales year-over-year.

Median Sales Price – Median of 53 metro median prices
In December 2018, the median of all 53 metro Median Sales Prices was $240,000, up 2.1% from November 2018, and up +2.1% from December 2017. Eight metro areas saw a year-over-year decrease in Median Sales Price, including Honolulu, HI, -7.7%, Birmingham, AL, -4.6%, and Billings, MT, -2.6%. Five metro areas increased year-over-year by double-digit percentages, with the largest increases seen in Boise, ID, +13.1%, Wichita, KS, +11.1%, and Salt Lake City, UT, +10.3%.

Days on Market – Average of 53 metro areas
The average Days on Market for homes sold in December 2018 was 54, up three days from the average in November 2018, and down three days from the December 2017 average. The metro areas with the lowest Days on Market were Omaha, NE, at 26, a tie at 37 in San Francisco, CA, and Salt Lake City, UT, and a tie at 38 in Nashville, TN, and Las Vegas, NV. The highest Days on Market averages were in Trenton, NJ, at 113, a tie at 90 in Augusta, ME, and Hartford, CT, and Burlington, VT, at 88. Days on Market is the number of days between when a home is first listed in an MLS and a sales contract is signed.

Months Supply of Inventory – Average of 53 metro areas
The number of homes for sale in December 2018 was down -10.8% from November 2018 and up +4.6% from December 2017. Based on the rate of home sales in December, the Months Supply of Inventory increased to 4.1 from 3.9 in November 2018, and increased compared to December 2017 at 3.7. In December 2018, four of the 53 metro areas surveyed reported a months supply over six, including Miami, FL, at 10.9 and Augusta, ME, at 8.9, which is typically considered a buyer’s market. The markets with the lowest Months Supply of Inventory are San Francisco, CA, at 1.8, Denver, CO, at 2.1, and Minneapolis, MN, at 2.2.

For specific data in this report or to request an interview, please contact newsroom@remax.com.

About the RE/MAX Network
As one of the leading global real estate franchisors, RE/MAX, LLC is a subsidiary of RE/MAX Holdings (NYSE: RMAX) with over 120,000 agents in more than 100 countries and territories. Nobody in the world sells more real estate than RE/MAX, as measured by residential transaction sides. Dedicated to innovation and change in the real estate industry, RE/MAX launched Motto Mortgage, a ground-breaking mortgage franchisor, in 2016 and acquired booj, a real estate technology company, in 2018. RE/MAX agents have lived, worked and served in their local communities for decades, raising millions of dollars every year for Children’s Miracle Network Hospitals® and other charities. To learn more about RE/MAX, to search home listings or find an agent in your community, please visit www.remax.com. For the latest news about RE/MAX, please visit www.remax.com/newsroom.

Description
The RE/MAX National Housing Report is distributed each month on or about the 15th. The first Report was distributed in August 2008. The Report is based on MLS data in approximately 53 metropolitan areas, includes all residential property types, and is not annualized. For maximum representation, many of the largest metro areas in the country are represented, and an attempt is made to include at least one metro from each state. Metro area definitions include the specific counties established by the U.S. Government’s Office of Management and Budget, with some exceptions.

Definitions
Transactions are the total number of closed residential transactions during the given month. Months Supply of Inventory is the total number of residential properties listed for sale at the end of the month (current inventory) divided by the number of sales contracts signed (pended) during the month. Where “pended” data is unavailable, this calculation is made using closed transactions. Days on Market is the number of days that pass from the time a property is listed until the property goes under contract for all residential properties sold during the month. Median Sales Price is the median of the median sales prices in each of the metro areas included in the survey.

MLS data is provided by contracted data aggregators, RE/MAX brokerages and regional offices. While MLS data is believed to be accurate, it cannot be guaranteed. MLS data is constantly being updated, making any analysis a snapshot at a particular time. Every month the RE/MAX National Housing Report re-calculates the previous period’s data to ensure accuracy over time. All raw data remains the intellectual property of each local MLS organization.

LendingTree Releases Monthly Mortgage Offer Report for December

LendingTree’s Chief Economist analyzes December’s mortgage offers

Charlotte, NC – Jan. 9, 2019 (PRNewswire) LendingTree®, the nation’s leading online loan marketplace, today released its monthly Mortgage Offers Report, which analyzes data from actual loan terms offered to borrowers on LendingTree.com by lenders on LendingTree’s network. The purpose of the report is to empower consumers by providing additional information on how their credit profile affects their loan prospects.

Lendingtree Logo

  • December’s best mortgage offers for borrowers with the best profiles had an average APR of 4.35% for conforming 30-year, fixed-rate purchase loans, down from 4.66% in November. The APR on refinance loan offers also decreased from 4.63% in November to 4.34%. We consider people with the best credit profiles to be those in the 95th percentile of borrowers who received the best mortgage offers through the LendingTree marketplace, which allows users to compare offers from multiple mortgage lenders.
  • Mortgage rates vary depending upon parameters including credit score, loan-to-value ratio, income and property type.
    For the average borrower, the purchase APR for conforming 30-year, fixed-rate purchase loans offered on LendingTree’s platform was 5.17%, down 18 basis points from November. The loan note rate of 5.05% was down 19 basis points from November. We prefer to emphasize the APR as lenders often make changes to other fees in response to changing interest rates.
  • Consumers with the highest credit scores (760+, representing the 65th percentile of borrowers) received an average APR of 4.98%, versus 5.33% for consumers with scores of 680 to 719. The APR spread of 65 basis points between these score ranges is higher than it was in November. For the average purchase loan amount of $224,609, the spread represents over $17,000 in additional costs for borrowers with lower credit scores over 30 years. The additional costs result from higher interest rates, larger fees or a combination of the two.
  • For the average borrower, the APR for conforming 30-year, fixed-rate refinance loans decreased 24 basis points from November to 5.09%. At 4.93% and 5.21%, respectively, the spread between credit score brackets (760+ and 680-719) was 28 basis points. That amounts to nearly $13,000 in extra costs over the life of the loan for borrowers with lower credit scores, given an average refinance loan of $239,329.
  • Average proposed purchase down payments fell to $54,217, a decline of nearly $6,000.

Chart

Purchase APR by Credit Score Range

Chart

* Lifetime interest paid is calculated based on the overall average loan amount to enable comparison.

Chart

*Lifetime interest paid is calculated based on the overall average loan amount to enable comparison.

To view the Mortgage Offers Report, visit: www.lendingtree.com.

LendingTree also released its weekly Mortgage Comparison Shopping Report, containing the Mortgage Rate Distribution and Mortgage Rate Competition Index. This week’s report found that 80.9 percent of purchase borrowers received mortgage rates under 5 percent last week. Homebuyers could have seen median lifetime savings of $30,377 in interest on a $300,000 loan by comparison shopping for the best mortgage rates.

About the Report

The LendingTree Mortgage Offers Report contains data from actual loan terms offered to borrowers on LendingTree.com by lenders. We believe it is an important addition to standard industry surveys and reports on mortgage rates. Most quoted industry rates are for a hypothetical borrower with prime credit who makes a 20% down payment. Most borrowers do not fit this profile. Our report includes the average quoted APR by credit score, together with the average down payment and other metrics described below. We stratify by credit score, so borrowers have added information on how their credit profile affects their loan prospects. The report covers conforming 30-yr fixed loans for both purchase and refinance.

  • APR: Actual APR offers to borrowers on our platform
  • Down Payment: Though analogous to the LTV, we find that borrowers identify more closely with the down payment. Academic studies have also found that the down payment is the primary concern for homebuyers and one of the main impediments to entering the homebuying market.
  • Loan Amount: The average loan amount borrowers are offered
  • LTV: Actual LTV offered to borrowers on our platform
  • Lifetime Interest Paid: This is the total cost a borrower incurs for the loan, inclusive of fees.

About LendingTree

LendingTree (NASDAQ: TREE) is the nation’s leading online marketplace that connects consumers with the choices they need to be confident in their financial decisions. LendingTree empowers consumers to shop for financial services the same way they would shop for airline tickets or hotel stays, comparing multiple offers from a nationwide network of over 500 partners in one simple search, and can choose the option that best fits their financial needs. Services include mortgage loans, mortgage refinances, auto loans, personal loans, business loans, student refinances, credit cards and more. Through the My LendingTree platform, consumers receive free credit scores, credit monitoring and recommendations to improve credit health. My LendingTree proactively compares consumers’ credit accounts against offers on our network, and notifies consumers when there is an opportunity to save money. In short, LendingTree’s purpose is to help simplify financial decisions for life’s meaningful moments through choice, education and support. LendingTree, LLC is a subsidiary of LendingTree, Inc. For more information, go to www.lendingtree.com, dial 800-555-TREE, like our Facebook page and/or follow us on Twitter @LendingTree.

Media Contact:

Megan Greuling
(704) 943-8208
Megan.greuling@lendingtree.com