U.S. Home Prices At Least Affordable Level Since Q3 2008

Home Prices Less Affordable Than Historic Averages In 59 Percent of Local Markets; 75 Percent of Local Markets Not Affordable for Average Wage Earners

Irvine, CA – June 21, 2018 (PRNewswire) ATTOM Data Solutions, curator of the nation’s premier property database, today released its Q2 2018 U.S. Home Affordability Report, which shows that the U.S. home prices in the first quarter were at the least affordable level since Q3 2008.

ATTOM Logo

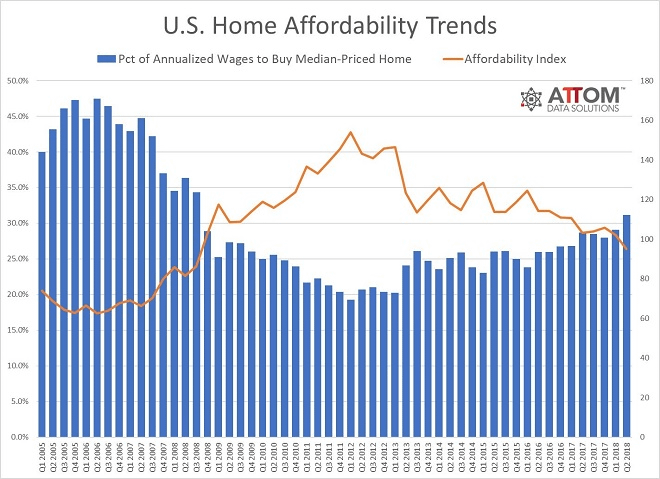
The report calculates an affordability index based on percentage of income needed to buy a median-priced home relative to historic averages, with an index above 100 indicating median home prices are more affordable than the historic average, and an index below 100 indicating median home prices are less affordable than the historic average. (See full methodology below.)

Nationwide, the Q2 2018 home affordability index of 95 was down from an index of 102 in the previous quarter and an index of 103 in Q2 2017 to the lowest level since Q3 2008, when the index was 86.

“Slowing home price appreciation in the second quarter was not enough to counteract an 11 percent increase in mortgage rates compared to a year ago, resulting in the worst home affordability we’ve seen in nearly 10 years,” said Daren Blomquist, senior vice president at ATTOM Data Solutions. “Meanwhile home price appreciation continued to outpace wage growth, speeding up the affordability treadmill for prospective homebuyers even without the rise in mortgage rates.”

Chart

Q2 2018 U.S. Home Affordability Heat Map by County

Home prices rising faster than wages in 64 percent of local markets
Nationwide the median home price of $245,000 in Q2 2018 was up 4.7 percent from a year, down from 7.4 percent appreciation in the first quarter but still above the average weekly wage growth of 3.3 percent. Since bottoming out in Q1 2012, median home prices nationwide have increased 75 percent while average weekly wages have increased 13 percent during the same period.

Annual growth in median home prices outpaced average wage growth in 275 of the 432 counties analyzed in the report (64 percent), including Los Angeles County, California; Maricopa County (Phoenix), Arizona; San Diego County, California; Orange County, California; and Miami-Dade County, Florida.

Lowest home affordability indexes in Flint, Denver, Santa Fe, Nashville
Counties with the lowest home affordability indexes in Q2 2018 were Genesee County (Flint), Michigan (70); Denver County, Colorado (72); Adams County (Denver area), Colorado (73); Santa Fe County, New Mexico (73); and Wilson County (Nashville area), Tennessee (75).

Among 40 counties with a population of at least 1 million, those with the lowest home affordability indexes in Q2 2018 were Travis County (Austin), Texas (77); Alameda County (San Francisco area), California (81); Santa Clara County (San Jose), California (82); Oakland County (Detroit area), Michigan (82); and San Francisco County, California (83).

Highest share of income needed to buy a home in Bay Area, Brooklyn
Nationwide an average wage earner would need to spend 31.2 percent of his or her income to buy a median-priced home in Q2 2018, above the historic average of 29.6 percent.

Counties with median home prices requiring the highest share of average wage earner income were Marin County (San Francisco area), California (133.2 percent); Kings County (Brooklyn), New York (123.1 percent); Santa Cruz County, California (121.5 percent); Monterey County (Salinas), California (100.3 percent); and San Francisco County, California (97.2 percent).

Counties with median home prices requiring the lowest share of average wage earner income were Wayne County (Detroit), Michigan (13.5 percent); Clayton County, Georgia (13.7 percent); Rock Island (Quad Cities), Illinois (15.8 percent); Saginaw County, Michigan (16.4 percent); and Richmond County (Augusta), Georgia (16.4 percent).

Median home prices not affordable for average wage earners in 75 percent of local markets
An average wage earner would not qualify to buy a median-priced home in 326 of the 432 counties (75 percent) analyzed in the report based on a 3 percent down payment and a maximum front-end debt-to-income ratio of 28 percent.

Counties where an average wage earner could not afford to buy a median-priced home in Q2 2018 included Los Angeles County, California; Cook County (Chicago), Illinois; Maricopa County (Phoenix), Arizona; San Diego County, California; and Orange County, California.

Report Methodology
The ATTOM Data Solutions U.S. Home Affordability Index analyzes median home prices derived from publicly recorded sales deed data collected by ATTOM Data Solutions and average wage data from the U.S. Bureau of Labor Statistics in 432 U.S. counties with a combined population of more than 217 million. The affordability index is based on the percentage of average wages needed to make monthly house payments on a median-priced home with a 30-year fixed rate mortgage and a 3 percent down payment, including property taxes, home insurance and mortgage insurance. Average 30-year fixed interest rates from the Freddie Mac Primary Mortgage Market Survey were used to calculate the monthly house payments. Only counties with sufficient home price and wage data quarterly back to Q1 2005 were used in the analysis.

The report determined affordability for average wage earners by calculating the amount of income needed to make monthly house payments — including mortgage, property taxes and insurance — on a median-priced home with, assuming a 3 percent down payment and a 28 percent maximum “front-end” debt-to-income ratio. For instance, the nationwide median home price of $245,000 in the first second quarter of 2018 would require an annual gross income of $61,709 for a buyer putting 3 percent down and not exceeding the recommended “front-end” debt-to-income ratio of 28 percent — meaning the buyer would not be spending more than 28 percent of his or her income on the house payment, including mortgage, property taxes and insurance. That required income is higher than the $55,393 annual income earned by an average wage earner based on the most recent average weekly wage data available from the Bureau of Labor Statistics, making a median-priced home nationwide not affordable for an average wage earner.

About ATTOM Data Solutions
ATTOM Data Solutions provides premium property data to power products that improve transparency, innovation, efficiency and disruption in a data-driven economy. ATTOM multi-sources property tax, deed, mortgage, foreclosure, environmental risk, natural hazard, and neighborhood data for more than 155 million U.S. residential and commercial properties covering 99 percent of the nation’s population. A rigorous data management process involving more than 20 steps validates, standardizes and enhances the data collected by ATTOM, assigning each property record with a persistent, unique ID — the ATTOM ID. The 9TB ATTOM Data Warehouse fuels innovation in many industries including mortgage, real estate, insurance, marketing, government and more through flexible data delivery solutions that include bulk file licenses, APIs, market trends, marketing lists, match & append and more.

Media Contact:
Christine Stricker
(949) 748-8428
christine.stricker@attomdata.com

Data and Report Licensing:
(949) 502-8313
datareports@attomdata.com

Home Prices Not Slowing Down According To S&P CoreLogic Case-Shiller Index

New York, NY – May 29, 2018 (PRNewswire) S&P Dow Jones Indices today released the latest results for the S&P CoreLogic Case-Shiller Indices, the leading measure of U.S. home prices. Data released today for March 2018 shows that home prices continued their rise across the country over the last 12 months. More than 27 years of history for these data series is available, and can be accessed in full by going to www.homeprice.spdji.com. Additional content on the housing market can also be found on S&P Dow Jones Indices’ housing blog: www.housingviews.com.

S P Dow Jones Indices Logo

YEAR-OVER-YEAR

The S&P CoreLogic Case-Shiller U.S. National Home Price NSA Index, covering all nine U.S. census divisions, reported a 6.5% annual gain in March, the same as the previous month. The 10-City Composite annual increase came in at 6.5%, up from 6.4% in the previous month. The 20-City Composite posted a 6.8% year-over-year gain, no change from the previous month.

Seattle, Las Vegas, and San Francisco continue to report the highest year-over-year gains among the 20 cities. In March, Seattle led the way with a 13.0% year-over-year price increase, followed by Las Vegas with a 12.4% increase and San Francisco with an 11.3% increase. Twelve of the 20 cities reported greater price increases in the year ending March 2018 versus the year ending February 2018.

The charts on the following page compare year-over-year returns of different housing price ranges (tiers) for the top two cities, Seattle and Las Vegas.

MONTH-OVER-MONTH

Before seasonal adjustment, the National Index posted a month-over-month gain of 0.8% in March. The 10-City and 20-City Composites reported increases of 0.9% and 1.0%, respectively. After seasonal adjustment, the National Index recorded a 0.4% month-over-month increase in March. The 10-City and 20-City Composites posted 0.4% and 0.5% month-over-month increases, respectively. All 20 cities reported increases in March before seasonal adjustment, while 19 of 20 cities reported increases after seasonal adjustment.

ANALYSIS

“The home price increases continue with the National Index rising at 6.5% per year,” says David M. Blitzer, Managing Director and Chairman of the Index Committee at S&P Dow Jones Indices. “Seattle continues to report the fastest rising prices at 13% per year, double the National Index pace. While Seattle has been the city with the largest gains for 19 months, the ranking among other cities varies. Las Vegas and San Francisco saw the second and third largest annual gains of 12.4% and 11.3%. A year ago, they ranked 10th and 16th. Any doubts that real, or inflation-adjusted, home prices are climbing rapidly are eliminated by considering Chicago; the city reported the lowest 12-month gain among all cities in the index of 2.8%, almost a percentage point ahead of the inflation rate.

“Looking across various national statistics on sales of new or existing homes, permits for new construction, and financing terms, two figures that stand out are rapidly rising home prices and low inventories of existing homes for sale. Months-supply, which combines inventory levels and sales, is currently at 3.8 months, lower than the levels of the 1990s, before the housing boom and bust. Until inventories increase faster than sales, or the economy slows significantly, home prices are likely to continue rising. Compared to the price gains of the last boom in the early 2000s, things are calmer today. Gains in the National Index peaked at 14.5% in September 2005, more quickly than Seattle is rising now.”

SUPPORTING DATA

Table 1 below shows the housing boom/bust peaks and troughs for the three composites along with the current levels and percentage changes from the peaks and troughs.

Chart

Table 2 below summarizes the results for March 2018. The S&P CoreLogic Case-Shiller Indices are revised for the prior 24 months, based on the receipt of additional source data.

Chart

Sources: S&P Dow Jones Indices and CoreLogic
Data through March 2018

Table 3 below shows a summary of the monthly changes using the seasonally adjusted (SA) and non-seasonally adjusted (NSA) data. Since its launch in early 2006, the S&P CoreLogic Case-Shiller Indices have published, and the markets have followed and reported on, the non-seasonally adjusted data set used in the headline indices. For analytical purposes, S&P Dow Jones Indices publishes a seasonally adjusted data set covered in the headline indices, as well as for the 17 of 20 markets with tiered price indices and the five condo markets that are tracked.

Chart

Sources: S&P Dow Jones Indices and CoreLogic
Data through March 2018

For more information about S&P Dow Jones Indices, please visit www.spdji.com.

ABOUT S&P DOW JONES INDICES

S&P Dow Jones Indices is the largest global resource for essential index-based concepts, data and research, and home to iconic financial market indicators, such as the S&P 500® and the Dow Jones Industrial Average®. More assets are invested in products based on our indices than products based on indices from any other provider in the world. Since Charles Dow invented the first index in 1884, S&P DJI has become home to over 1,000,000 indices across the spectrum of asset classes that have helped define the way investors measure and trade the markets.

S&P Dow Jones Indices is a division of S&P Global (NYSE: SPGI), which provides essential intelligence for individuals, companies, and governments to make decisions with confidence. For more information, visit www.spdji.com.

FOR MORE INFORMATION:

David Blitzer
Managing Director and Chairman of Index Committee
New York, USA
(+1) 212 438 3907
david.blitzer@spglobal.com

Soogyung Jordan
Global Head of Communications
New York, USA
(+1) 212 438 2297
soogyung.jordan@spglobal.com

Luke Shane
North America Communications
New York, USA
(+1) 212 438 8184
luke.shane@spglobal.com

S&P Dow Jones Indices’ interactive blog, HousingViews.com, delivers real-time commentary and analysis from industry experts across S&P Global on a wide-range of topics impacting residential home prices, homebuilding and mortgage financing in the United States. Readers and viewers can visit the blog at www.housingviews.com, where feedback and commentary is welcomed and encouraged.

The S&P CoreLogic Case-Shiller Indices are published on the last Tuesday of each month at 9:00 am ET. They are constructed to accurately track the price path of typical single-family homes located in each metropolitan area provided. Each index combines matched price pairs for thousands of individual houses from the available universe of arms-length sales data. The S&P CoreLogic Case-Shiller U.S. National Home Price Index tracks the value of single-family housing within the United States. The index is a composite of single-family home price indices for the nine U.S. Census divisions and is calculated quarterly. The S&P CoreLogic Case-Shiller 10-City Composite Home Price Index is a value-weighted average of the 10 original metro area indices. The S&P CoreLogic Case-Shiller 20-City Composite Home Price Index is a value-weighted average of the 20 metro area indices. The indices have a base value of 100 in January 2000; thus, for example, a current index value of 150 translates to a 50% appreciation rate since January 2000 for a typical home located within the subject market.

These indices are generated and published under agreements between S&P Dow Jones Indices and CoreLogic, Inc.

The S&P CoreLogic Case-Shiller Indices are produced by CoreLogic, Inc. In addition to the S&P CoreLogic Case-Shiller Indices, CoreLogic also offers home price index sets covering thousands of zip codes, counties, metro areas, and state markets. The indices, published by S&P Dow Jones Indices, represent just a small subset of the broader data available through CoreLogic.

Case-Shiller® and CoreLogic® are trademarks of CoreLogic Case-Shiller, LLC or its affiliates or subsidiaries (“CoreLogic”) and have been licensed for use by S&P Dow Jones Indices. None of the financial products based on indices produced by CoreLogic or its predecessors in interest are sponsored, sold, or promoted by CoreLogic, and neither CoreLogic nor any of its affiliates, subsidiaries, or predecessors in interest makes any representation regarding the advisability of investing in such products.