LendingTree Ranks Most Competitive Homebuyer Markets

LendingTree Study Reveals Where Homebuyer Competition is Toughest Based on Down Payment Percentages, Credit Scores and Pre-Approved Financing

Charlotte, NC – Jan. 18, 2018 (PRNewswire) LendingTree®, the nation’s leading online loan marketplace, has released the findings of its study on where homebuyers will face the fiercest competition to achieve their dream of homeownership in 2018.

lendingtree

We’ve been hearing for years about competitive housing markets, but with low levels of housing inventory and rising home prices, almost any market can be competitive. What it really comes down to is the competition among buyers. That’s why LendingTree ranked the top 100 Most Competitive Homebuyer Markets based on the house hunters who are putting more money down, have high credit scores and start loan shopping before home shopping.

Chart 1

Chart 2

Chart 3

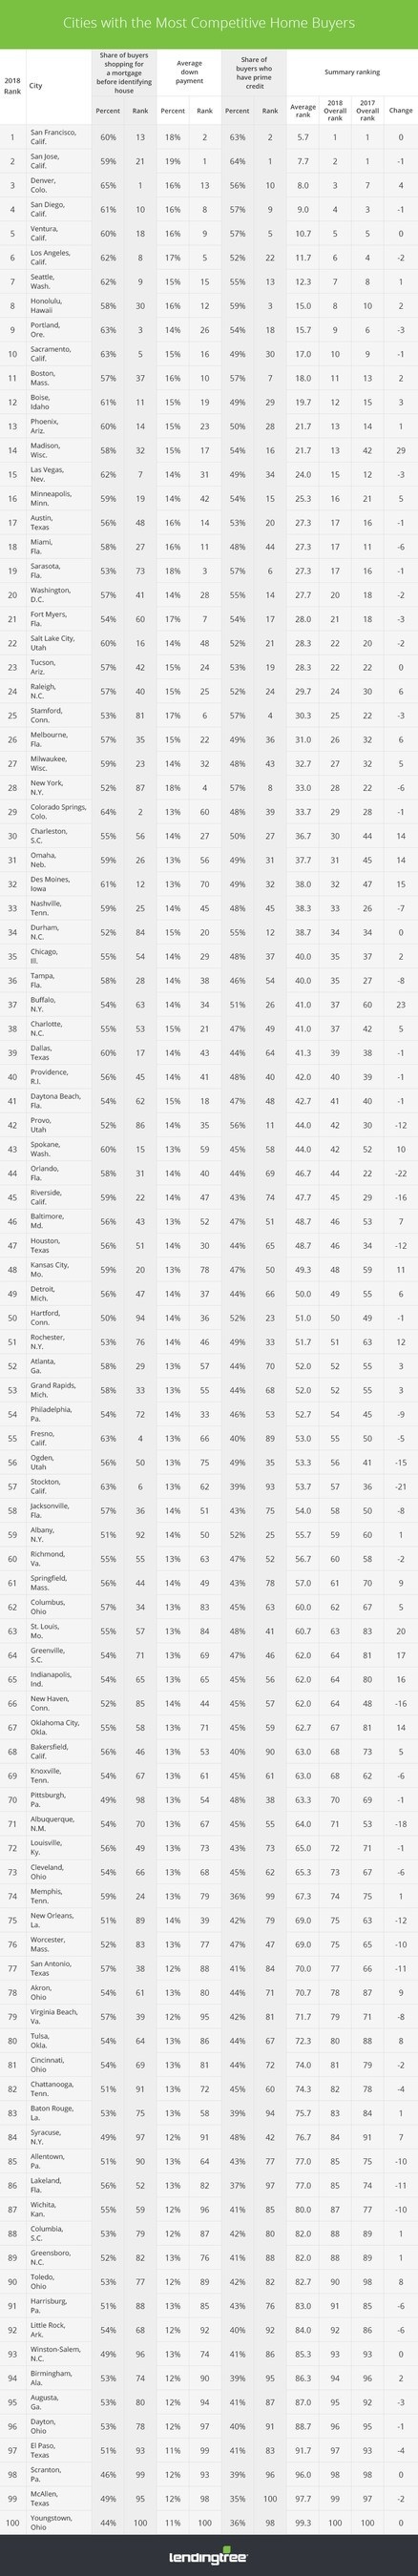
LendingTree looked at 1.5 million purchase mortgage loan requests that came through the LendingTree marketplace in the 100 largest cities in 2017. The study ranks cities using three criteria:

  • The share of buyers shopping for a mortgage before identifying the house they want. Buyers with financing in place are more appealing to sellers and can compete with cash buyers.
  • Average down payment percentage. Having a higher amount of money saved for a down payment can enable you to borrow more money or be offered a lower interest rate, allowing you to make a stronger offer.
  • Percentage of buyers who have prime credit (above 680). Borrowers with higher scores have more financing options to make more competitive offers. The cities/markets below are ranked for 2018 using the criteria noted above, including the relative data used to determine the ranking along with the market’s overall rank from the prior year.

Key Findings:

California markets dominate the top 10.

Six of the top 10 most competitive housing markets are in California. San Francisco and San Jose lead the rankings in 2018, with a vast number of credit-worthy and well-heeled borrowers making it one of the most challenging markets for prospective home shoppers.

Some 60 percent of home shoppers applied for a mortgage before identifying a house. The two cities also came to the table with the highest average down payment of any region, at 19 percent. Furthermore, nearly two-thirds (64%) of Bay Area shoppers had prime credit scores, above 680.

Tech industries are key.

The strength in the Bay Area may be attributed to the concentration of high-paying technology jobs. This also applies to Seattle, which came in at No. 7, and Portland at No. 9.

Go west. When you get to the water, keep going.

The top 10 are all in western states. If you go further west you get to Honolulu, another top 10 city. The rest of the country comes into play with Boston at No. 11, also a technology hub.

The opposite to being the most competitive is not a bad thing. Here are the most accessible cities:

At the other end of the list are three cities where less than half of home shoppers apply for their mortgage before house hunting; the average home shopper offers a down payment of just 12 percent and less than 40 percent of shoppers have prime credit scores. This is great news for buyers in Youngstown, Ohio, McAllen, Texas, and Scranton, Pa., and other accessible cities, which are often in rustbelt and southern states, as homeownership is accessible to a larger part of the population.

Regardless of the level of competition in your area, being a well-prepared buyer increases your odds of securing that dream home. The most significant of the three variables is having financing in place, giving homebuyers a leg up on the competition and reducing delays in the process. Buyers with less cash available for a down payment or those with less than perfect credit should start the loan process even earlier to get pre-approved before house hunting. Homebuyers across the credit or down payment spectrum should check their credit scores beforehand, know what they can reasonably afford, and shop around for multiple loan offers since interest rates vary between lenders – regardless of whether they are in the hottest, or most accessible housing markets in America.

For more information on the study, click here.

About LendingTree

LendingTree (NASDAQ: TREE) is the nation’s leading online loan marketplace, empowering consumers as they comparison-shop across a full suite of loan and credit-based offerings. LendingTree provides an online marketplace which connects consumers with multiple lenders that compete for their business, as well as an array of online tools and information to help consumers find the best loan. Since inception, LendingTree has facilitated more than 65 million loan requests. LendingTree provides free monthly credit scores through My LendingTree and access to its network of over 500 lenders offering home loans, personal loans, credit cards, student loans, business loans, home equity loans/lines of credit, auto loans and more. LendingTree, LLC is a subsidiary of LendingTree, Inc. For more information go to www.lendingtree.com, dial 800-555-TREE, like our Facebook page and/or follow us on Twitter @LendingTree.

MEDIA CONTACT:

Megan Greuling
(704) 943-8208
Megan.greuling@lendingtree.com

Redfin: 2017 Closed with Strong Home Price Growth, Up 7 Percent in December

– For the full year, 2017 home sales increased 1.7 percent over 2016, while prices gained 7.0 percent. The median 2017 sale price was $284,500.

– National home prices rose 6.8 percent in December as inventory declined 14.5 percent.

– Facing the Lowest Supply on Record, San Jose Had Higher Price Growth, More Competition and Faster Sales than Any Other Market in December

Seattle, WA – Jan. 18, 2018 (PRNewswire) (NASDAQ: RDFN) Home prices finished the year strong, up 6.8 percent in December from last year, according to Redfin (www.redfin.com), the next-generation real estate brokerage. The median sale price was $287,000 across the markets Redfin serves. Sales were down 2.8 percent ending a year of fluctuating sales growth. The number of homes for sale declined 14.5 percent compared to a year ago, marking 27 months in a row of inventory declines.The typical home that sold in December found a buyer after 49 days on the market, five days fewer than 2016.

Redfin Logo

“Like last year, low inventory will be the biggest driver of the 2018 real estate market,” said Redfin chief economist Nela Richardson. “Major housing market dynamics don’t shift dramatically when the clock strikes midnight on Jan. 1. We anticipate a continuation of the same trends we’ve been seeing for the past few years. Price growth will remain strong as many homeowners will remain deterred from selling due to the low mortgage rates they’ve locked in and the high price of their would-be move-up home.”

The number of homes newly listed for sale in December decreased 3.0 percent. With just 2.6 months of supply in December, the market was far below the six months of supply that represents balance between buyers and sellers.

Chart 1

Facing Lowest Supply on Record, San Jose Prices Rose 31.9 Percent Year Over Year

San Jose had only 0.5 months of supply in December, the lowest monthly supply Redfin has recorded in any metro area. This means that if the pace of home sales continued and no new homes were listed, it would only take about two weeks for all the homes currently for sale to find buyers. Seattle and Oakland also faced extremely tight markets with just 0.6 months of supply in December.

Unsurprisingly, San Jose was the fastest and most competitive market in December with the typical home finding a buyer in a median of 12 days, followed by Seattle and Oakland at 15 and 16 days respectively. More than three-quarters (76.2%) of San Jose homes sold above the list price. Of all the metro areas Redfin tracks, San Jose has had the steepest year-over-year price growth and inventory declines for three months in a row.

Redfin San Jose agent Kalena Masching says that despite the high prices (her market had a median sale price of $1.1 million in December) San Jose remains more affordable than San Francisco.

“Even highly-paid tech workers are priced out of San Francisco and moving to San Jose. This demand coupled with low inventory and job growth at the tech campuses in the South Bay has caused prices to soar.”

Other December Highlights

Competition

  • San Jose, CA was the fastest market for the third month in a row, with half of all homes pending sale in just 12 days, down from 39 days in December 2016. Seattle, WA and Oakland, CA were the next fastest markets at 15 and 16 median days on market, followed by Boston, MA (20) and San Francisco, CA (21).
  • San Jose, CA was again the most competitive market with 76.2% of homes selling above list price, followed by 68.8% in San Francisco, CA, 62.1% in Oakland, CA, 40.2% in Seattle, WA, and 38.8% in Los Angeles, CA.

Prices

  • San Jose, CA had the nation’s highest price growth for the third month in a row, rising 31.9% since last year to $1,108,000. Las Vegas, NV had the second highest growth at 17.3% year-over-year price growth, followed by Baton Rouge, LA (15.3%), Seattle, WA (15%), and San Francisco, CA (14.7%).
  • 2 metros saw price declines in December: Albany, NY (-3.2%) and Camden, NJ (-0.7%).

Sales

  • 5 out of 73 metros saw sales surge by double digits from last year. Camden, NJ led the nation in year-over-year sales growth, up 21.3%, followed by Louisville, KY, up 14.5%. Orlando, FL rounded out the top three with sales up 14.2% from a year ago.v
  • Cincinnati, OH saw the largest decline in sales since last year, falling 20.8%. Home sales in Portland, OR and Oxnard, CA both declined by 15.6%.

Inventory

  • San Jose, CA had the largest decrease in overall inventory for the third month in a row, falling 51.5% since last December. Oakland, CA (-36.4%), Seattle, WA (-34.0%), and Atlanta, GA (-33.1%) also saw far fewer homes available on the market than a year ago.
  • Baton Rouge, LA had the highest increase in the number of homes for sale, up 12.8% year over year, followed by New Orleans, LA (6.8%) and Austin, TX (5.2%).

To read the full report, complete with data and charts, click here.

About Redfin
Redfin (www.redfin.com) is the next-generation real estate brokerage, combining its own full-service agents with modern technology to redefine real estate in the consumer’s favor. Founded by software engineers, Redfin has the country’s #1 brokerage website and offers a host of online tools to consumers, including the Redfin Estimate, the automated home-value estimate with the industry’s lowest published error rate for listed homes. Homebuyers and sellers enjoy a full-service, technology-powered experience from Redfin real estate agents, while saving thousands in commissions. Redfin serves more than 80 major metro areas across the U.S. The company has closed more than $50 billion in home sales.

U.S. Foreclosure Activity Drops To 12-Year Low In 2017

But New York Foreclosure Auctions, New Jersey REOs Both at 11-Year High; Biggest Backlogs of Legacy Foreclosures in New York, New Jersey, Florida

Irvine, CA – Jan. 18, 2018 (PRNewswire) ATTOM Data Solutions, curator of the nation’s largest multi-sourced property database, today released its Year-End 2017 U.S. Foreclosure Market Report, which shows foreclosure filings — default notices, scheduled auctions and bank repossessions — were reported on 676,535 U.S. properties in 2017, down 27 percent from 2016 and down 76 percent from a peak of nearly 2.9 million in 2010 to the lowest level since 2005. The U.S. foreclosure rate in 2017 was 0.51 percent of housing units with a foreclosure filing, also a 12-year low.

ATTOM Logo

“Thanks to a housing boom driven primarily by a scarcity of supply, which has helped to limit home purchases to the most highly qualified — and low-risk — borrowers, the U.S. housing market has the luxury of playing a version of foreclosure limbo in which it searches for how low foreclosures can go,” said Daren Blomquist, senior vice president at ATTOM Data Solutions.

Foreclosure starts at new record low nationwide, increase in DC and five states

Lenders started the foreclosure process on 383,701 U.S. properties in 2017, down 20 percent from 2016 to a new all-time low going back as far as foreclosure start data is available — 2006.

“Across Southern California, while foreclosures have maintained historically low levels during much of 2017, housing affordability has become the concern that has many watching the market for a potential shift in the near future,” said Michael Mahon, president of First Team Real Estate, covering the Southern California market, which also posted an 11-year low in foreclosure starts in 2017. “With wage growth not meeting equity growth across many Southern California markets — coupled with rising interest rates — there are some concerns that foreclosures could be on the rise in 2018.”

Counter to the national trend, the District of Columbia and five states posted year-over-year increases in foreclosure starts in 2017, including Illinois (up 2 percent); Oklahoma (up 23 percent); Louisiana (up 2 percent); DC (up 54 percent); West Virginia (up 32 percent); and Vermont (up 27 percent).

New York foreclosure auctions at 11-year high, counter to 11-year low nationwide

A total of 318,165 U.S. properties were scheduled for public foreclosure auction (the same as a foreclosure start in some states) in 2017, down 27 percent from 2016 to a new all-time low going back as far as foreclosure auction data is available — 2006.

“The data for the Seattle market tells a very big story, and that is we are not seeing a housing bubble forming,” said Matthew Gardner, chief economist at Windermere Real Estate, covering the Seattle market, where scheduled foreclosure auctions in 2017 dropped 47 percent to an 11-year low. “With foreclosure rates at less than 0.4 percent of total housing units, the market is remarkably stable. That said, we are certainly suffering from serious affordability issues, but this is not translating into defaults on loans.”

The District of Columbia and seven states posted a year-over-year increase in scheduled foreclosure auctions in 2017, including New York (up 9 percent to the highest level since 2006); Oklahoma (up 4 percent); Connecticut (up 7 percent); and Maine (up 2 percent).

New Jersey bank repossessions at 11-year high, counter to 11-year low nationwide

Lenders repossessed 291,579 properties through foreclosure (REO) in 2017, down 23 percent from 2016 to the lowest level since 2006 — an 11-year low.

Counter to the national trend, the District of Columbia and seven states posted a year-over-year increase in REOs in 2017, led by New Jersey (19 percent increase to the highest level since 2006); Delaware (up 16 percent); Montana (up 12 percent); DC (up 10 percent); and Wyoming (up 10 percent).

Top foreclosure rates in 2017

States with the highest foreclosure rates in 2017 were New Jersey (1.61 percent of housing units with a foreclosure filing); Delaware (1.13 percent) and Maryland (0.95 percent).

Average time to foreclose jumps above 1,000 days nationwide

U.S. properties foreclosed in the fourth quarter of 2017 had been in the foreclosure process an average of 1,027 days, a 14 percent jump from the previous quarter and a 28 percent increase from a year ago.

Full Report and Methodology

About ATTOM Data Solutions

ATTOM Data Solutions is the curator of the ATTOM Data Warehouse, a multi-sourced national property database that blends property tax, deed, mortgage, foreclosure, environmental risk, natural hazard, health hazards, neighborhood characteristics and other property characteristic data for more than 150 million U.S. residential and commercial properties. The ATTOM Data Warehouse delivers actionable data to businesses, consumers, government agencies, universities, policymakers including bulk file licenses, APIs and customized reports.

Media Contact:

Christine Stricker
(714) 873-4275
christine.stricker@attomdata.com

Data and Report Licensing:

(949) 502-8313
datareports@attomdata.com