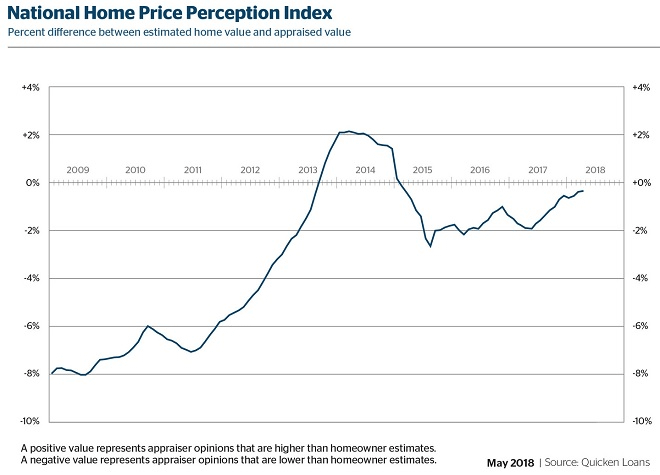
– Quicken Loans’ National HPPI shows appraised values 0.33% lower than homeowners estimated in April
– Home values dipped 0.05% nationally in April, but posted a 6.47% year-over-year increase, according to the Quicken Loans HVI
Detroit, MI – May 8, 2018 (PRNewswire) Home appraisals are more likely be in line with, or even higher than, owners estimate. In April, appraised values were only 0.33 percent lower than what homeowners expected, according to the National Quicken Loans Home Price Perception Index (HPPI). The positive trend is apparent at the local level as well. Only five of the 27 metro areas observed in the HPPI reported appraisals lower than what owners estimated.

While they are more in line with what owners expected, home values are continuing their ascent over last year’s level. The National Quicken Loans Home Value Index (HVI) reported a healthy 6.47 percent year-over-year increase, despite near stagnant monthly change, with a 0.05 percent dip in home values since March.
Home Price Perception Index (HPPI)
Homeowners are less likely to get a rude awakening when going through mortgage process. When viewed at a national level, the HPPI shows appraisers’ opinions of home value is an average of 0.33 percent lower than homeowners’ estimates. This is a move closer to equilibrium and the closest the national appraiser and owner opinions have been in more than three years. Homeowner opinions are also improving when viewed locally. Less than 20 percent of the areas measured have appraisal values lower than estimated. San Jose is leading the way with the average appraisal 2.75 percent higher than expected and Chicago is trailing all cities with appraisals an average of 1.68 percent lower than estimated.
“The appraisal is one of the most important, although sometimes least predictable, parts of the mortgage process,” said Bill Banfield, Quicken Loans Executive Vice President of Capital Markets. “The Home Price Perception Index is a way to illustrate the differences of opinion, and these differences affect everything from the type of mortgage a borrower can get to the expectations a seller has about the proceeds available upon sale of their home.”

Home Value Index (HVI)
The Quicken Loans HVI, the only measurement of home value changes based solely on appraisal data, showed annual growth in the national index, increasing 6.47 percent from this time last year. Monthly changes were more tempered, with the national index dipping 0.05 percent. The national index was pulled into the negative by the Northeast, the only region showing a decrease in home value at a 1.24 percent decline. The Northeast was still the lowest when reviewing annual changes however all regions were positive – ranging from the Northeast’s 2.22 percent growth to the 9.44 percent jump in the West.
“The skyrocketing home values in the West is a trend with no end in sight. Until home building pace picks up, in combination with more existing homes being listed for sale, affordability will continue to wane,” Banfield said. “The other regions of the country are showing annual price gains as well but at a more moderate pace. Time will tell if the slightly higher interest rates in 2018 start to slow demand or if the inventory shortage ends up being a larger contributor to price changes.”

*A positive value represents appraiser opinions that are higher than homeowner perceptions. A negative value represents appraiser opinions that are lower than homeowner perceptions.

*A positive value represents appraiser opinions that are higher than homeowner perceptions. A negative value represents appraiser opinions that are lower than homeowner perceptions.

*A positive value represents appraiser opinions that are higher than homeowner perceptions. A negative value represents appraiser opinions that are lower than homeowner perceptions.
About the HPPI & HVI
The Quicken Loans HPPI represents the difference between appraisers’ and homeowners’ opinions of home values. The index compares the estimate that the homeowner supplies on a refinance mortgage application to the appraisal that is performed later in the mortgage process. This is an unprecedented report that gives a never-before-seen analysis of how homeowners are viewing the housing market. The HPPI national composite is determined by analyzing appraisal and homeowner estimates throughout the entire country, including data points from both inside and outside the metro areas specifically called out in the above report.
The Quicken Loans HVI is the only view of home value trends based solely on appraisal data from home purchases and mortgage refinances. This produces a wide data set and is focused on appraisals, one of the most important pieces of information to the mortgage process.
The HPPI and HVI are released on the second Tuesday of every month. Both of the reports are created with Quicken Loans’ propriety mortgage data from the 50-state lenders’ mortgage activity across all 3,000+ counties. The indexes are examined nationally, in four geographic regions and the HPPI is reported for 27 major metropolitan areas. All indexes, along with downloadable tables and graphs can be found at QuickenLoans.com/Indexes.
About Quicken Loans
Detroit-based Quicken Loans Inc. is the nation’s largest home mortgage lender. The company closed more than $400 billion of mortgage volume across all 50 states from 2013 through 2017. Quicken Loans moved its headquarters to downtown Detroit in 2010. Today, Quicken Loans and its Family of Companies employ more than 17,000 full-time team members in Detroit’s urban core. The company generates loan production from web centers located in Detroit, Cleveland and Phoenix. Quicken Loans also operates a centralized loan processing facility in Detroit, as well as its San Diego-based One Reverse Mortgage unit. Quicken Loans ranked highest in the country for customer satisfaction for primary mortgage origination by J.D. Power for the past eight consecutive years, 2010 – 2017, and also ranked highest in the country for customer satisfaction among all mortgage servicers the past four consecutive years, 2014 – 2017.
Quicken Loans was once again named to FORTUNE magazine’s “100 Best Companies to Work For” list in 2018 and has been included in the magazine’s top 1/3rd of companies named to the list for the past 15 consecutive years. The company was also named the #1 place to work in technology in 2017 by Computerworld magazine’s “100 Best Places to Work in IT,” a recognition it has received 8 times in the past 12 years.
Like this:
Like Loading...